Figure 5.
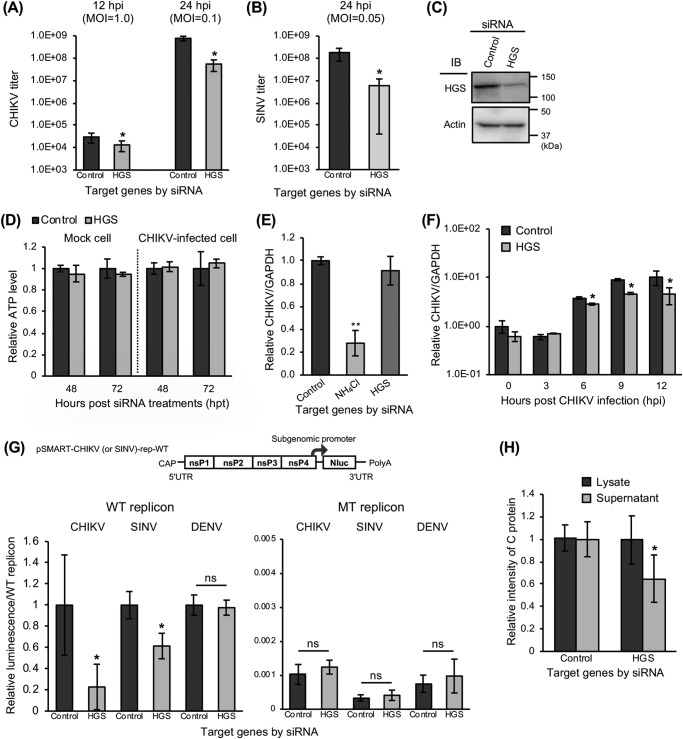
Significant inhibition of genome replication and post-translational steps of CHIKV infection by KD of HGS. A and B, following the reverse transfection of siRNAs against HGS, HEK293T cells were inoculated with CHIKV (MOI = 1.0 or 0.1) (A) or SINV (MOI = 0.05) (B). Virus titers were determined by plaque assay using cell supernatants collected at the indicated time points. C, protein expression levels of HGS and β-actin (control) in siRNA-treated cells were determined by immunoblotting (IB). D, relative viability of the siRNA-treated cell was evaluated by measuring cellular ATP levels 48 and 72 h after siRNA treatments and normalizing with control siRNA-treated cells. The results of mock cells are shown on the left, and CHIKV-infected cells are shown on the right. E, intracellular viral RNA levels were examined at 3 hpi of CHIKV infection (MOI = 0.1) into siRNA-treated HEK293T cells. NH4Cl-treated cells were used as a control. F, time course of CHIKV genome expression in siRNA-treated HEK293T cells inoculated with CHIKV (MOI = 0.1) for 12 h after CHIKV infection. Intracellular viral RNA levels were measured at the indicated time points. E and F, expression of viral RNA and GAPDH mRNA was determined by qRT-PCR using total RNAs extracted from trypsinized CHIKV-infected cells. G, genome organization of WT CHIKV (or SINV) replicon encoding NanoLuc (Nluc) is shown in the schematic at the top. HEK293T cells were transfected with siRNAs, incubated for 48 h, and transfected with replicon-expressing plasmids (WT CHIKV, SINV, or DENV replicon– or RNA-dependent RNA polymerase-inactivated mutant (MT) CHIKV, SINV, or DENV replicon–expressing plasmids). The luciferase activities, which represent replication efficiency, were measured at 24 hpt of replicon-expressing plasmids and normalized to each WT replicon. H, HEK293T cells were transfected with siRNAs and incubated for 48 h. Then, the cells were transfected with CHIKV-VLP-expressing plasmids. At 48 hpt of CHIKV-VLP–expressing plasmids, the culture supernatants and cells were collected and lysed with TNE lysis buffers. The amount of C protein, representing the amount of CHIKV-VLP in both lysate and supernatant samples, was then analyzed by the intensity of specific bands observed by immunoblotting. All relative data were normalized against control cells and represented as means ± S.D. (error bars), collected in triplicate and independently at least two times (D, E, F, and H). Statistical significance was assessed using Student's t test (A, B, D, F, G, and H) or one-way ANOVA with Dunnett's test (E) and is indicated by asterisks (*, p < 0.05; **, p < 0.001; ns, not significant, compared between control cells).

