
Figure 7.
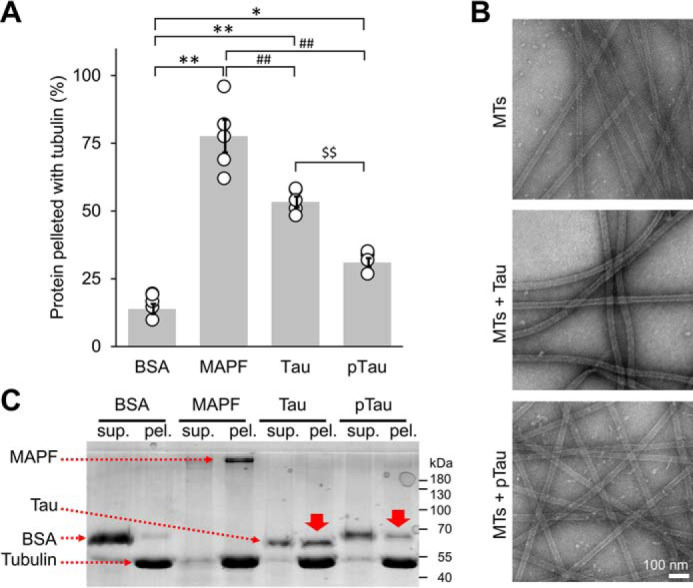
Tau/microtubule-binding assay. A, the binding propensity of pTau to the MTs was quantified as the percent of protein pelleted when incubated with pre-formed paclitaxel-stabilized MTs at a single concentration (250 μg/ml of pTau and 100 μg/ml of tubulin). Tau bound to tubulin with about 50% efficiency, whereas this efficiency was decreased to about 30% in the case of pTau. As a negative control, we used BSA, which showed low MT binding efficiency of 12%. As a positive control, the MAPF was used and showed a high binding of 78%. The averaged quantification was from 5 repeats, represented as mean ± S.D. with individual points plotted. One-way ANOVA with Tukey's multiple comparisons test was used, significance of values are denoted by: *, p < 0.05; **, ## and $$, p < 0.001. B, EM micrographs of paclitaxel-stabilized MTs alone and incubated with Tau or pTau. Scale bar = 100 nm for all images. C, representative total protein SDS-PAGE illustrating less pTau protein in the pellet fraction compared with Tau (solid red arrows). sup. = supernatant; pel. = pellet.