Figure 5.
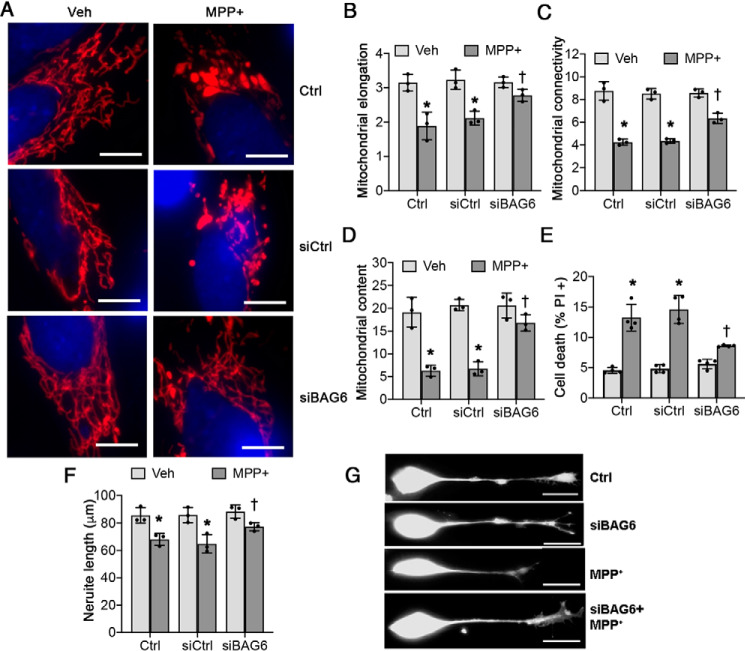
Knockdown of BAG6 protein prevents neurite shortening and reduces MPP+-induced mitochondrial fragmentation and cell death. Differentiated SH-SY5Y cells were treated with siRNA followed by MPP+ as in Fig. 4. A–D, siRNA-mediated knockdown of BAG6 prevents chronic MPP+ treatment–induced mitochondrial changes. A, mitochondria were visualized by immunostaining for mitochondrial antigen 60 kDa (Mito P60), and nuclei were visualized using 4′,6′-diamino-2-phenylindole. Scale bars, 20 μm. B and C, knockdown of BAG6 with siRNA rescues chronic MPP+-induced changes in mitochondrial elongation (*, p = 0.0009 for Ctrl (MPP+ versus vehicle (Veh)); *, p = 0.0027 for control siRNA (siCtrl, MPP+ versus vehicle); †, p = 0.045 for MPP+ (siBAG6 versus siCtrl); B) and mitochondrial connectivity index (*, p < 0.0001 for Ctrl (MPP+ versus vehicle); *, p < 0.0001 for siCtrl (MPP+ versus vehicle); †, p = 0.0034 for MPP+ (siBAG6 versus siCtrl); C). D, knockdown of BAG6 rescues chronic MPP+-induced loss of mitochondrial content (percentage of cellular area occupied by mitochondria). *, p < 0.0001 for Ctrl (MPP+ versus vehicle); *, p < 0.0001 for siCtrl (MPP+ versus vehicle); †, p = 0.0011 for MPP+ (siBAG6 versus siCtrl). E, chronic MPP+ treatment–induced cell death is partially rescued by down-regulation of BAG6 expression using siRNA. *, p < 0.0001 for Ctrl (MPP+ versus vehicle); *, p < 0.0001 for siCtrl (MPP+ versus vehicle); †, p = 0.0001 for MPP+ (siBAG6 versus siCtrl). F and G, chronic MPP+ treatment–induced neurite shortening in differentiated SH-SY5Y cells is rescued by siRNA mediated knockdown of BAG6. *, p = 0.0181 for Ctrl (MPP+ versus vehicle); *, p = 0.0043 for siCtrl (MPP+ versus vehicle); †, p = 0.0214 for MPP+ (siBAG6 versus siCtrl). Scale bar, 50 μm. Graphs represent means ± S.D.; n = 3 independent experiments for B–D and F; n = 4 independent experiments for E; two-way ANOVA with post hoc Bonferroni corrected t test (see Table 2 for analysis of main factors and interaction).

