Figure 7.
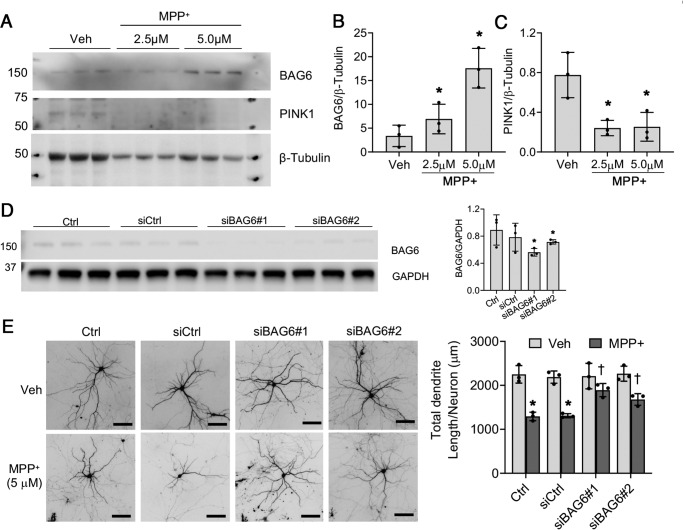
Chronic, low-dose MPP+ elevates BAG6 and reduces PINK1 levels in primary neurons, and siBAG6 protects against neuronal injury. A–C, mouse primary cortical neurons were plated at 1 × 10⁶ cells/well in 6-well plates. At DIV7, the cells were treated with 2.5 and 5 μm of MPP+ for an additional 7 days, with half medium changes containing fresh toxin on DIV9 and DIV12. The cells were harvested and lysed for Western blotting analysis at DIV14. For BAG6 densitometry, *, p = 0.01854 for 2.5 μm MPP+ versus vehicle (Veh); *, p = 0.0065 for 5.0 μm MPP+ versus vehicle. For PINK1 densitometry, *, p = 0.0184 for 2.5 μm MPP+ versus vehicle; *, p = 0.0287 for 5.0 μm MPP+ versus vehicle. The data were analyzed by one-way ANOVA followed by Bonferroni's multiple comparison test (see Table 1 for details). D, mouse primary cortical neurons were either transfected with control siRNA (siCtrl) or 25 nm of siBAG6#1 or siBAG6#2 at DIV7. A second transfection with the same amount of siRNA was done at DIV11. The cells were harvested and lysed at DIV14 for Western blotting analysis (left panel) and densitometry (right panel) of Bag6 knockdown in mouse primary cortical neurons. *, p = 0.01442 for siBAG6#1 versus siCtrl; *, p = 0.0485 for siBAG6#2 versus siCtrl; Bonferroni-corrected two-tailed t test. E, mouse primary neurons plated on LabTek chamber slides were transfected with 25 nm of the indicated siRNA as described for D. The neurons were treated with 5 μm of MPP+ as described for A. The dendritic arbor of transfected neurons was visualized by co-transfection with GFP (left panels). Summated dendrite length per neuron was quantified (right panel) as described under “Experimental procedures.” *, p < 0.0001 for Ctrl (MPP+ versus vehicle); *, p = 0.0002 for siCtrl (MPP+ versus vehicle); †, p = 0.0170 for MPP+ (siBAG6#1 versus siCtrl); †, p = 0.0354 for MPP+ (siBAG6#2 versus siCtrl). Scale bar, 100 μm. The data were analyzed by two-way ANOVA with post hoc Bonferroni-corrected t test (see Table 2 for analysis of main factors and interactions). All graphs represent means ± S.D. from three independent experiments.

