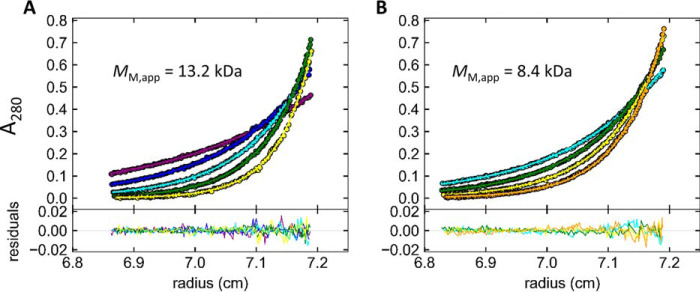
Figure 11.
Analytical ultracentrifugation of the Nck1-SH3.1 domain reveals dimers (A) and monomers (B) in solution. Multispeed sedimentation equilibrium, radial, and time-invariant noise-subtracted absorption data at 280 nm are shown at the top as dots with global fits as solid lines. Purple, blue, cyan, green, yellow, and orange correspond to 20,000, 25,000, 30,000, 35,000, 40,000, and 45,000 rpm, respectively. The residuals of the fits are shown at the bottom. The sample in B was generated by preincubation of a 50 μm dimeric Nck1-SH3.1 preparation at 42 °C for 24 h to induce monomer formation. Use of 10 μm sample concentrations and detection at 250 nm did not significantly change the results, as expected (Fig. S3). For completeness and comparison with other detection wavelengths and sample concentrations, these panels are also present in Fig. S3.

