Figure 7.
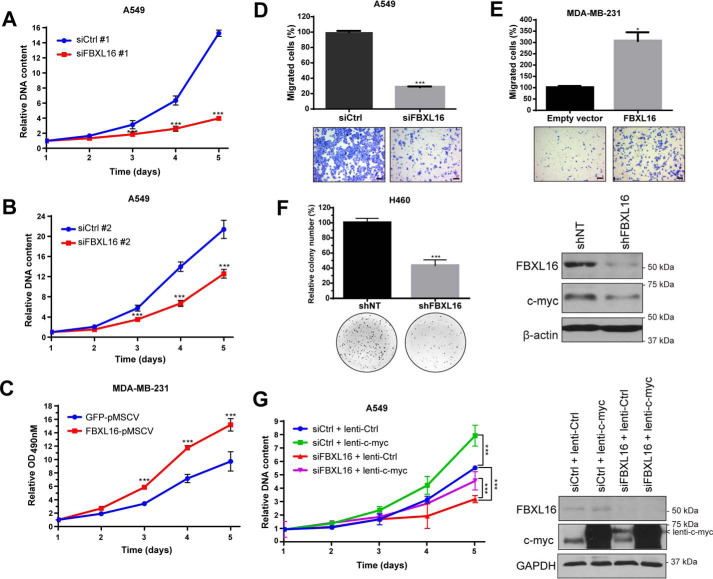
FBXL16 promotes cancer cell growth and migration. A, cell growth was determined by dsDNA quantification. After transient transfection of A549 cells with a negative control siRNA (siCtrl #1) or an siRNA targeting FBXL16 (siFBXL16 #1), DNA content was measured every 24 h and values were normalized to day 1. B, A549 cells were transiently transfected with siCtrl#2 or siFBXL16#2 and cell growth was assessed as in (A). C, an MTS proliferation assay was performed for MDA-MB-231 stable cells overexpressing pMSCV-GFP or pMSCV-FBXL16. Cell viability was determined by measuring A490 nm every 24 h and values were normalized to day 1. A–C, values in graphs represent mean ± S.D. of a representative experiment and statistical significances were determined by two-way ANOVA (*, p < 0.05; **, p < 0.01; ***, p < 0.001). D, A549 cells were transfected with siCtrl or siFBXL16 and their ability to migrate was analyzed by a two-chamber Transwell assay. Migrated cells were stained and photographed for quantification by counting. The migration ability of cells treated with siFBXL16 is presented as the percentage of the number of migrated cells per field in siFBXL16 over that of siCtrl. E, MDA-MB-231 cells were transiently transfected with an empty vector control or FBXL16 and their ability to migrate was analyzed as in (D). D and E, values in the bar graphs represent mean ± S.E. of three independent experiments. Statistical significance was determined by Student's t test (*, p < 0.05; **, p < 0.01; ***, p < 0.001). Representative images are shown at the bottom of the graphs. Scale bars, 100 μm. F, stable H460 cell lines with inducible expression of a nontargeting control shRNA (shNT) or a shRNA targeting FBXL16 (shFBXL16) were grown in soft agar in presence of doxycycline (0.5 μg/ml). After 8 days, colonies were stained and quantified using ImageJ software. The colony formation relative to shNT was determined from the average of two experiments with three replicates each time. Values in bar graphs represent mean ± S.E. Representative wells are shown at the bottom of the graphs. On the right, FBXL16 knockdown was confirmed by Western blot analysis after 5 days of doxycycline treatment (0.5 μg/ml). G, A549 cells were transiently transfected with siCtrl or siFBXL16 and transduced with a control lentivirus (lenti-Ctrl) or lentiviral FLAG-tagged c-myc (lenti-c-myc). Cell growth was assessed by dsDNA quantification as in (A). Values in graph represent mean ± S.D. of a representative experiment. Statistical significance on day 5 was determined by two-way ANOVA (*, p < 0.05; **, p < 0.01; ***, p < 0.001). On the right, knockdown of FBXL16 and lentiviral overexpression of FLAG-tagged c-myc (lenti-c-myc) were confirmed by Western blot analysis 2 days post transfection.

