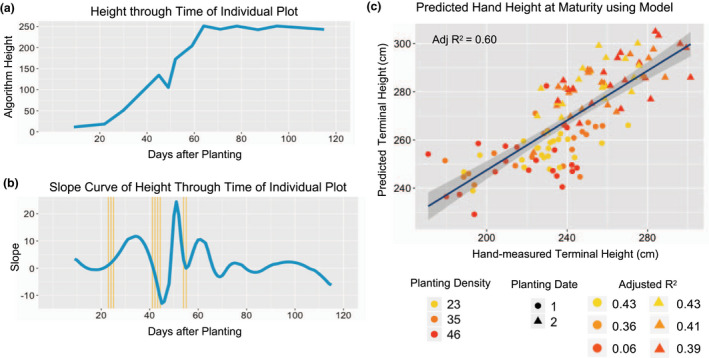
FIGURE 6.

Predicting terminal height using rate of change in height at certain intervals. (a) Height through time for an individual plot as recorded by the UAV. (b) First derivative of the height through time spline curve in blue and the selected timepoints were the slope contributed most to the prediction of terminal height in yellow. (c) Correlation of predicted terminal height on the test dataset utilizing a linear regression model derived from the training dataset based on slope values of selected timepoints and the hand‐measured height values at maturity. UAV, unmanned aerial vehicle
