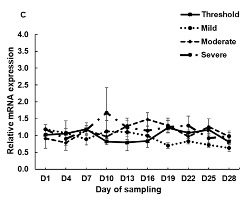
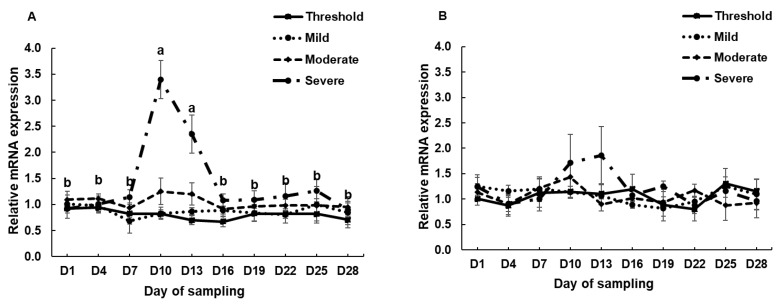
Figure 3.

mRNA expression of (a), HSP70, (b) HSP90, and (c) HSPB1 in the PBMCs of calves during the climate chamber experiment. Data are presented as the means ± standards error (n = 4). a, b Means with different superscripts differ significantly (p < 0.05) among the sampling dates based on Tukey’s test.

