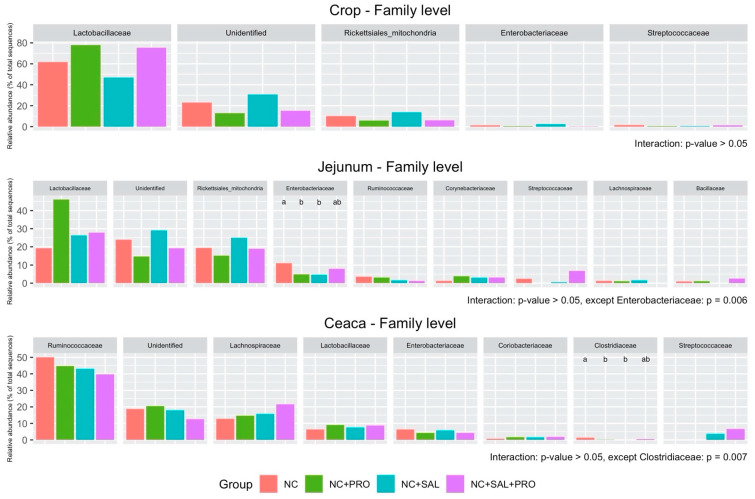
Figure 4.
Relative abundance of dominant microbiota at the family level in the crop, jejunal, and cecal digesta samples: NC—control diet with no additives; NC + PRO—B. licheniformis preparation (1.6 × 10⁹ CFU/kg diet); NC + SAL—salinomycin addition (60 ppm); NC + SAL + PRO—a mixture of salinomycin (60 ppm) and B. licheniformis (1.6 × 10⁹ CFU/kg diet); means represent 10 pens of one chick each pooled by two (n = 5).

