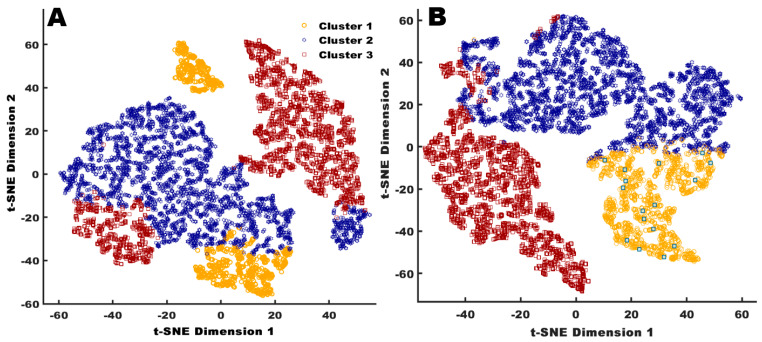
Figure 3.
Two-dimensional scatter plot of t-Distributed Stochastic Neighbor Embedding (t-SNE) visualizing cluster assignments of individual hens by agglomerative (A) and K-means algorithm (B), where cluster 1 hens (orange circles), cluster 2 hens (dark blue star), and cluster 3 hens (dark red square), grouped according to their similarity of time duration at the feeders, nest boxes, and on the range.

