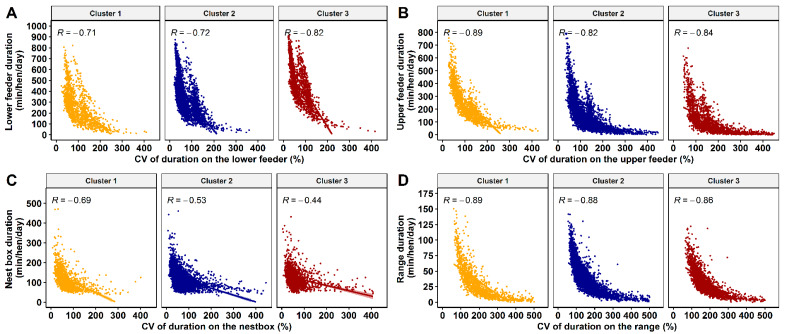
Figure 6.
The bivariate correlation plot of coefficient of variation for the daily duration and mean daily duration for cluster 1 (orange), 2 (dark blue), and 3 (dark red) based on K-means solution for lower feeder zone (A), upper feeder zone (B), nest box (C) and outdoor range (D). Each dot represents each hen in clusters 1, 2, and 3, while the shaded area around the correlation line represents the confidence interval. All correlation coefficients are significant with p-values < 0.0001.

