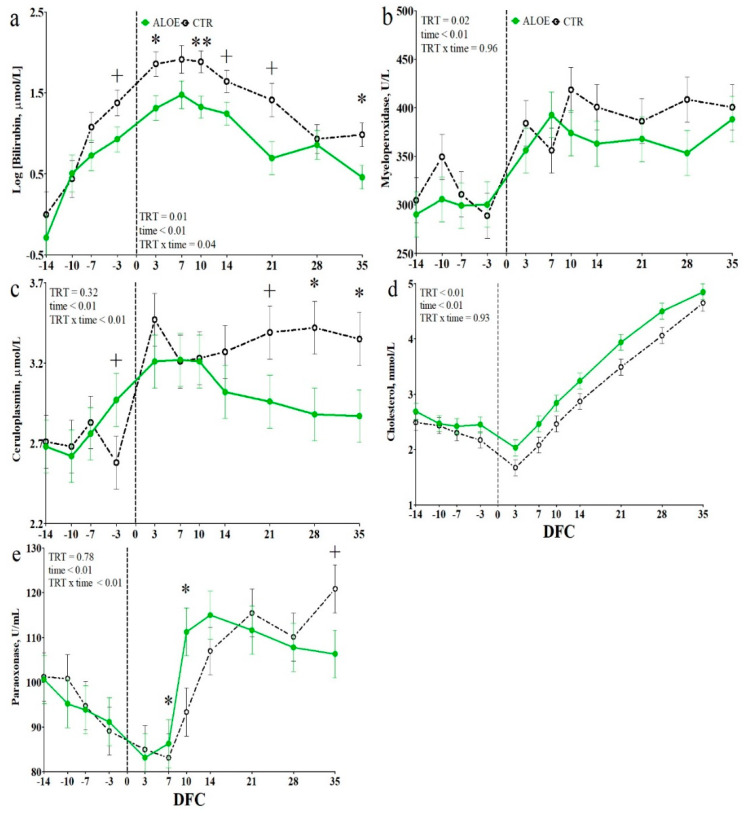
Figure 4.
Time course of plasma concentrations of bilirubin (a), myeloperoxidase (b), ceruloplasmin (c), cholesterol (d) and paraoxonase (e) in dairy cows receiving placebo water (CTR; black dotted line) or cows receiving a drench of 200 g/d of Aloe arborescens Mill. whole plant homogenate between −14 and 14 days from calving (AAM; green solid line). ** is p < 0.01; * is p < 0.05; + is p < 0.1; Log indicates data expressed as log-transformed; DFC is days from calving.

