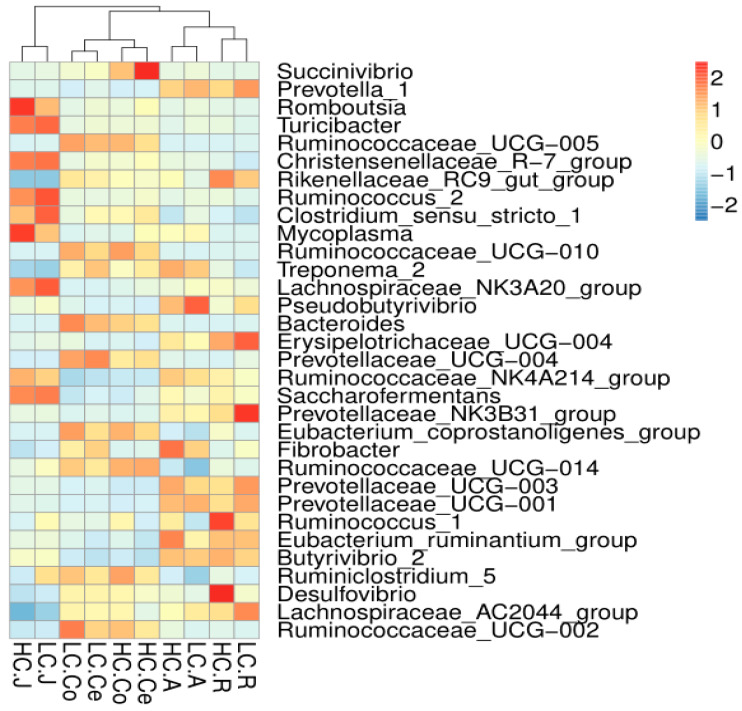
Figure 5.
Heatmap of the core genera across the gastrointestinal tract (the relative abundance of microbes was log-transformed, and only the top 32 abundant genera are presented). The closer to the color red, the higher the relative abundance, while the closer to the color blue, the lower the relative abundance.

