Figure 3.
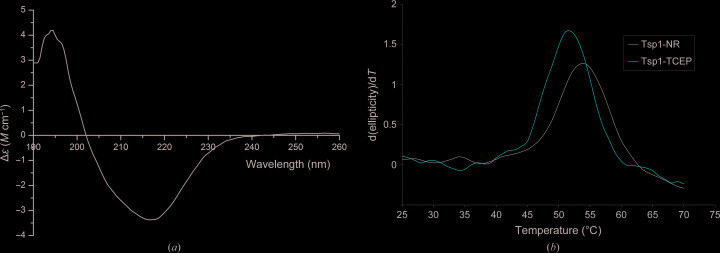
Circular-dichroism (CD) analysis. (a) Graph showing the change in differential molar extinction coefficient recorded in the wavelength range 190–260 nm. (b) Melting curve of Tsp1 under nonreducing (Tsp1-NR) and reducing conditions including 2 mM TCEP (Tsp1-TCEP) as estimated by recording the change in ellipticity with increasing temperature at 216 nm wavelength. The derivative of ellipticity is plotted against temperature. The melting temperature of Tsp1 was estimated to be nearly 54°C under nonreducing conditions and 52°C under reducing conditions.

