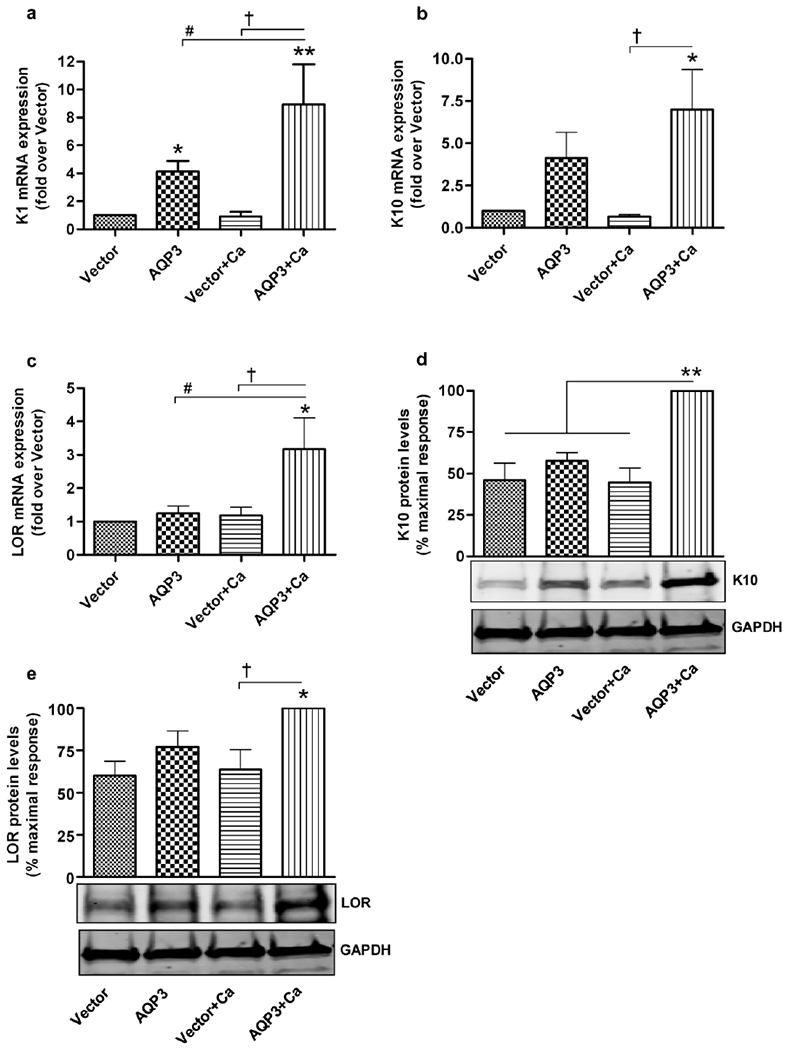
Figure 2. AQP3 re-expression increases expression of differentiation markers in AQP3-knockout keratinocytes.

Keratinocytes from AQP3-knockout neonatal mice were treated as described in Figure 1. Cells were harvested for quantitative RT-PCR (qRT-PCR) analysis of the expression of (a) keratin 1 (K1), (b) keratin 10 (K10) and (c) loricrin (LOR). Expression was analyzed with the ΔΔCt method using an average value of GAPDH and RPLP0 as endogenous controls, and values are shown as the fold over the vector-infected group. (d and e) Cells were harvested for Western analysis using antibodies against (d) keratin 10 (K10) and (e) loricrin (LOR) with GAPDH as the loading control. Quantitation of the values from three independent experiments is shown, with values expressed as the percent (%) maximal response. *p<0.05, **p<0.01 compared to the vector-infected group and the other indicated groups (in panel d); † or #p<0.05 versus the indicated groups.
