
Figure 2.
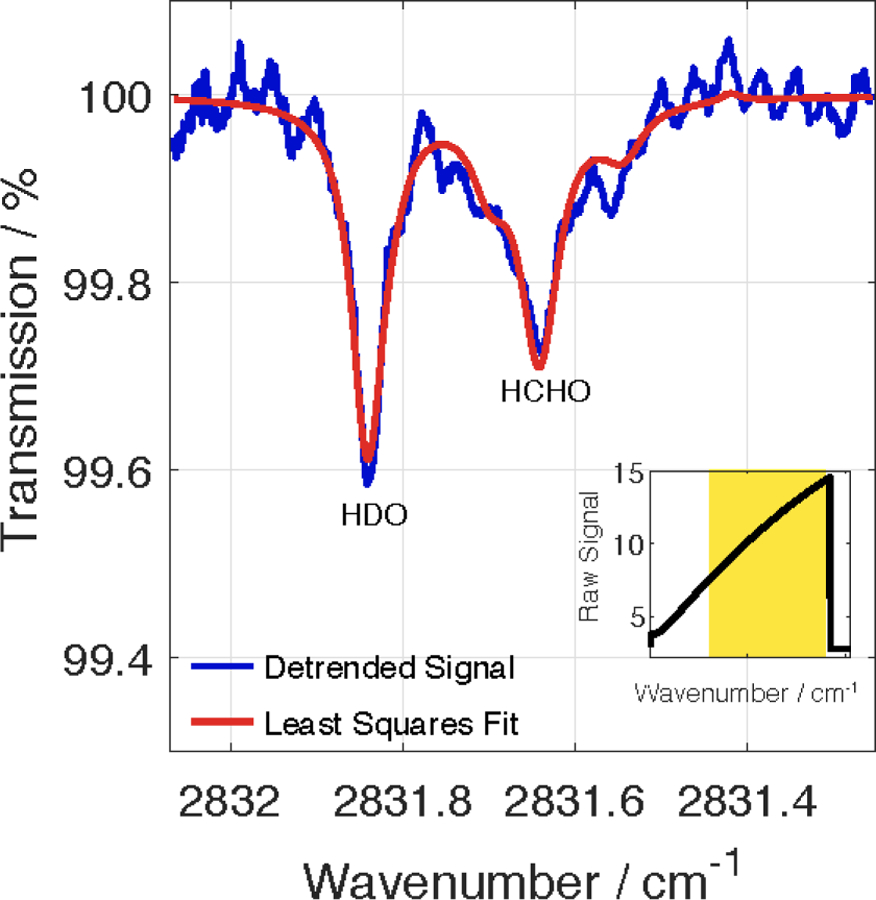
When the H2O mixing ratio is above 2000 ppmv, the HDO line at 2831.8413 cm−1 rises above the fringing caused by etalons in the detection cell so that the position of the HCHO line at 2831.6413 cm−1 can be reliably located and the spectral line fit. The fit depicted corresponds to a HCHO mixing ratio around 800 ppbv. (inset) 1 Hz raw data from the sensor before baseline subtraction. The yellow shaded region corresponds to the wavelength range being fit.