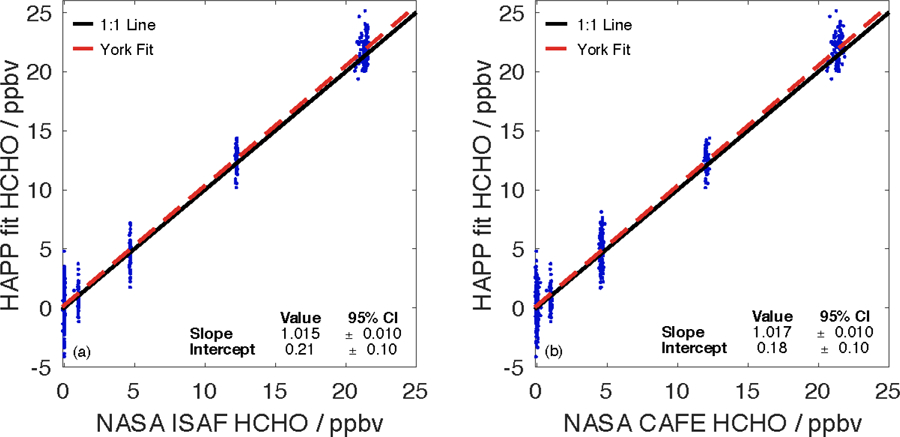
Figure 4.

Correlation plots between the HAPP HDO fit and two NASA LIF instruments: (a) NASA ISAF (R2 = 0.979) and (b) NASA CAFE (R2 = 0.976). A time series plot for the stepped intercomparison performed at NASA Goddard is located in the supplemental information (Fig. S4).
