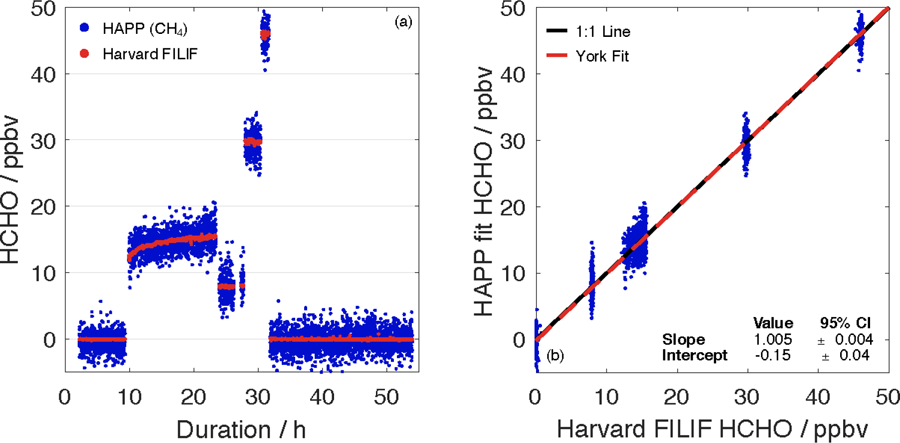
Figure 5.

(a) Time series of the Aeris sensor (HAPP CH4 fit) and Harvard FILIF during a multi–day stepped intercomparison. All data are reported with an integration time of 30 s. (b) Correlation plot between the Aeris sensor (HAPP CH4 fit) and Harvard FILIF (R2 = 0.980).
