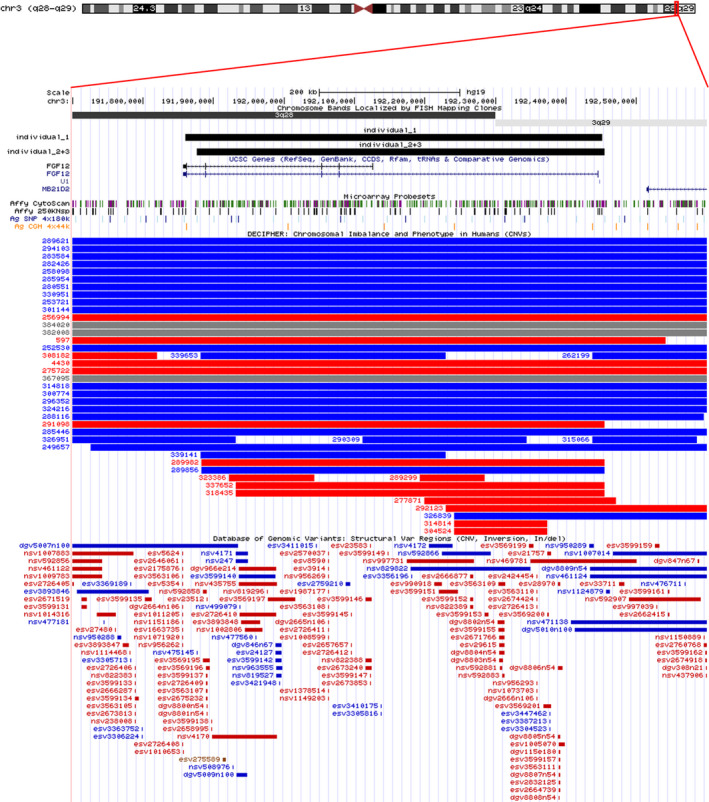
Figure 1.

Graphic presentation of the overlapping gains in band q28q29 of chromosome 3, encompassing FGF12. Schematic representation of chromosome 3 with the 3q28q29 region enlarged in the lower part of the figure (screen shot of the UCSC genome browser build 37/hg19 (http://genome.ucsc.edu/)) with gains detected in individuals 1, 2, and 3 shown as black solid rectangles above the genes in this region. The small vertical bars indicate the probe coverage of the different array platforms, and the blue and red rectangles represent gains and losses, respectively, in the DECIPHER database and the Database of Genomic Variants 10
