
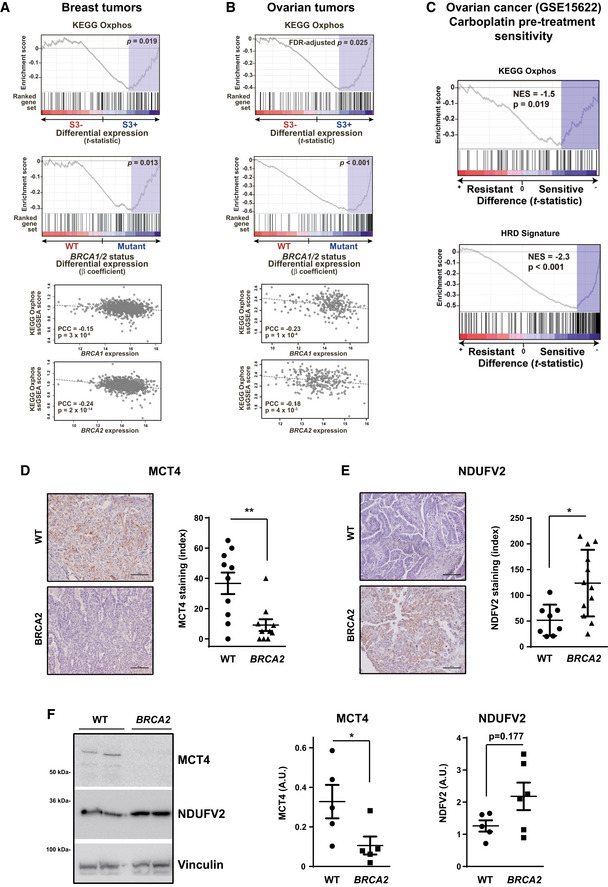
Figure 1. HR defects are associated with OXPHOS gene overexpression.
-
A, BGSEA results regarding the association between OXPHOS gene set overexpression and positivity for mutational signature 3 (associated with HR defects) in TCGA breast cancers (A) and TCGA ovarian cancer data (B). Top panel, enrichment score, gene ranking (based on the t‐statistic of the expression differences between negative (S3−) and positive (S3+) tumors), and false‐discovery rate (FDR)‐adjusted P values are shown. Middle panel shows similar GSEA results using as metric the β coefficient of differential expression between BRCA1/2 wild‐type and mutant tumors, including the covariates of age at diagnosis and tumor stage. Bottom panels, scatter plots showing the correlations (Pearson's correlation coefficients and P values) between the ssGSEA scores of the OXPHOS gene set and the BRCA1 (top) and BRCA2 (bottom) somatic gene expression values.
-
CGSEA results of KEGG OXPHOS (top panel) and HRD (bottom panel) signature score comparisons between carboplatin‐resistant (left) and carboplatin‐sensitive (right) ovarian tumors, using pre‐treatment expression data (GSE15622 data). The normalized enrichment scores (NESs) and corresponding P values are indicated. The NES is negative because the comparison is between resistant and sensitive tumors, so negative values mean that expression is higher in the second term (i.e., sensitive tumors).
-
DLeft panel, MCT4 staining of wild‐type and BRCA2‐mutated high‐grade serous ovarian tumors. Scale bars, 100 μm. Right panel, quantification of MCT4 levels using the multiplicative index in tumor tissue sections from wild‐type (n = 10) and BRCA2‐mutated (n = 8) high‐grade serous tumors. Error bars indicate the SEM. **P = 0.0055 (two‐tailed unpaired Mann–Whitney U‐test).
-
ELeft panel, NDUFV2 staining of wild‐type and BRCA2‐mutated high‐grade serous ovarian tumors. Scale bars, 100 μm. Right panel, quantification of NDUFV2 levels using the multiplicative index in tumor tissue sections from wild‐type (n = 8) and BRCA2‐mutated (n = 12) high‐grade serous tumors. Error bars indicate the SEM. *P = 0.0101 (two‐tailed unpaired Mann–Whitney U‐test).
-
FSamples from wild‐type (WT, n = 5) and BRCA2‐mutated (n = 6) high‐grade serous ovarian tumors were lysed and immunoblotted using the indicated antibodies. Left panel: A representative blot of two independent tumors is shown. Right panel: Bars show the relative immunoreactivity of MCT4 or NDUFV2 proteins normalized with respect to vinculin in samples from the left. Error bars indicate the SEM. Statistical significance of two‐tailed unpaired Mann–Whitney U‐tests, *P = 0.0317.
Source data are available online for this figure.