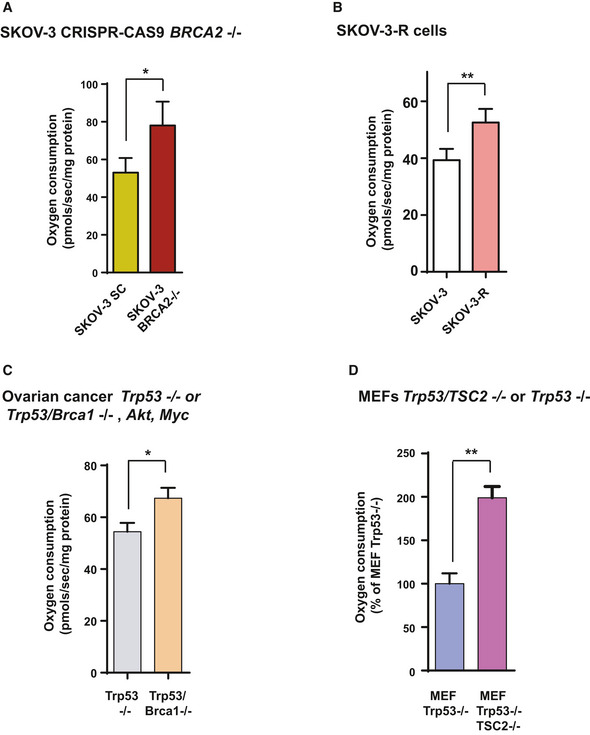
Figure EV1. HRD cell models show high OXPHOS.

-
AOxygen consumption rates measured using an Oxygraph‐2K in control SKOV‐3 SC (n = 5) and SKOV‐3‐BRCA2 −/− 1.2 (n = 3) human ovarian tumor cells. The bars indicate the mean and standard error (SEM). Statistical significance of two‐tailed Mann–Whitney U‐tests: *P = 0.0238.
-
BOxygen consumption rates measured using an Oxygraph‐2K in SKOV‐3 control (n = 5) and SKOV‐3‐R (n = 5) human ovarian tumor cells. The bars indicate the mean and standard error (SEM). Statistical significance of two‐tailed unpaired Mann–Whitney U‐tests: **P = 0.007.
-
COxygen consumption rates measured using an Oxygraph‐2K in Trp53 −/−, myc and Akt (n = 8) or Trp53 −/−, Brca1 −/−, myc, and Akt (n = 8) ovarian mouse cancer cells. The bars indicate the mean and standard error (SEM). Statistical significance of two‐tailed Mann–Whitney U‐tests: *P = 0.0281.
-
DOxygen consumption rates measured using an Oxygraph‐2K in Trp53‐deficient (n = 4) and double Trp53/Tsc2‐deleted MEFs (n = 4). The bars indicate the mean and standard error (SEM). Statistical significance of two‐tailed Mann–Whitney U‐tests: **P = 0.0014.
