
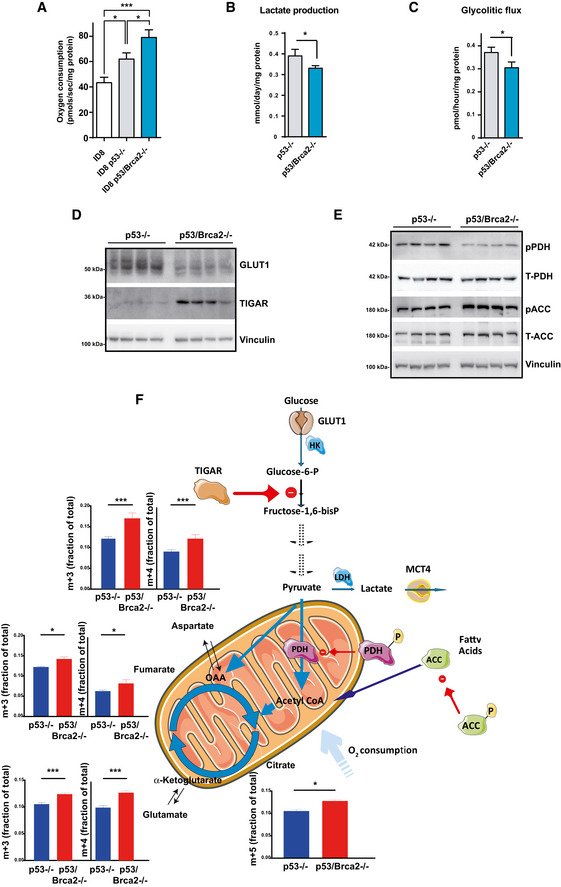
Figure 2. Genomic instable cell models show high oxygen consumption and decreased glycolytic flux.
-
AOxygen consumption rates measured using an Oxygraph‐2K in ID8 control (n = 10), ID8 Trp53‐deleted (n = 18), and double Trp53/Brca2‐deleted (n = 17) mouse ovarian tumor cells. The bars indicate the mean and standard error (SEM). Statistical significance of two‐tailed unpaired Mann–Whitney U‐tests: ID8 control versus ID8 Trp53‐deleted, *P = 0.0266; ID8 control versus double Trp53/Brca2‐deleted, ***P = 0.0009; ID8 Trp53‐deleted versus double Trp53/Brca2‐deleted, *P = 0.0204.
-
BLactate production (mmol) was measured in DMEM from ID8 Trp53‐deleted (n = 4, 0.36, 0.42, 0.37, and 0. 38) and Trp53/Brca2‐deleted (n = 4, 0.33, 0.31, 0.33, and 0.33) ovarian tumor cells grown for 24 h. Data were normalized with respect to protein content. Error bars indicate the SEM. Statistical significance of two‐tailed unpaired Mann–Whitney U‐tests, *P = 0.0236.
-
CGlycolytic flux was measured in ID8 Trp53‐deleted (n = 4, 0.346, 0.361, 0.377, and 0.400) and Trp53/Brca2‐deleted (n = 3, 0.276, 0.324, and 0.314) ovarian tumor cells grown for 24 h in DMEM complete medium and in the presence 3H‐glucose for the final 60 min. Measurements (in pmol 3H H2O produced) were normalized relative to protein content. Error bars indicate the SEM. Statistical significance of two‐tailed unpaired Mann–Whitney U‐tests, *P = 0.0153.
-
DID8 Trp53‐deleted (n = 4) and Trp53/Brca2‐deleted (n = 4) ovarian tumor cells were grown in complete DMEM for 3 days. Cells were lysed and immunoblotted using the indicated antibodies.
-
EID8 Trp53‐deleted (n = 4) and Trp53/Brca2‐deleted (n = 4) ovarian tumor cells were grown in complete DMEM for 3 days. Cells were lysed and immunoblotted using the indicated antibodies.
-
FTargeted metabolomic enrichment analysis using C13‐U‐Glucose as substrate. M+3 (left panels) isotopolog enrichment and m+4 (right panels) isotopolog enrichment of fumarate, aspartate (equilibrating with the oxaloacetate pool), and glutamate (equilibrating with the α‐ketoglutarate pool) are shown to illustrate TCA cycle entry of pyruvate carbons, and cycling. Citrate m+5 enrichment is also shown as a measure of the capacity of the mitochondria to oxidize fully labeled pyruvate. The mean of four replicates for each cell line is shown. Error bars indicate the SEM. Statistical significance of citrate m+5 by two‐tailed unpaired Mann–Whitney U‐test, Trp53‐deleted versus Trp53/Brca2‐deleted cells *P = 0.0286. Statistical significance of one‐way ANOVA, Holm–Sidak's multiple comparisons test Trp53‐deleted versus Trp53/Brca2‐deleted cells: Glutamate, m+3 ***P < 0.0001, m+4 ***P < 0.0001; fumarate, m+3 *P = 0.0033, m+4 *P = 0.0051; aspartate, m+3 ***P < 0.0001, m+4 ***P < 0.0001.
Source data are available online for this figure.