
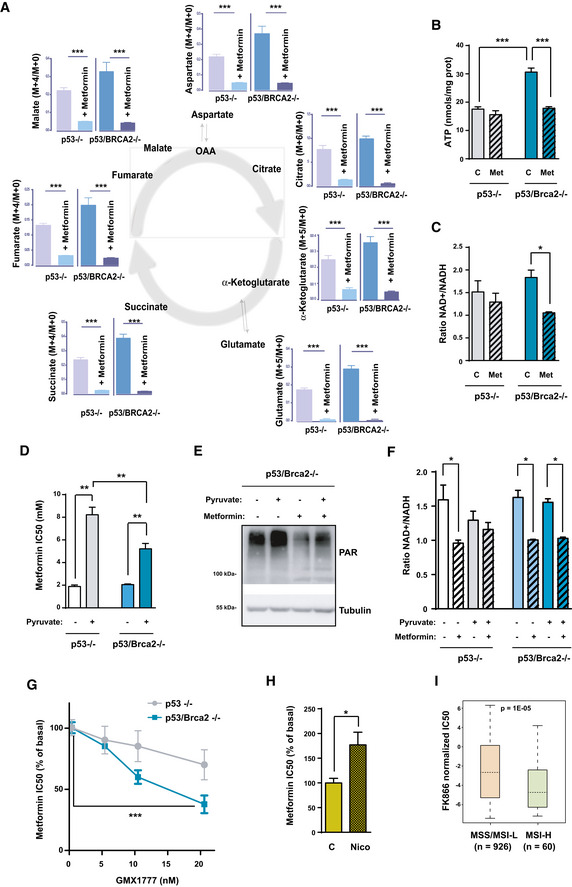
Figure 4. Metformin affects metabolites of the TCA cycle, ATP, and the NAD +/NADH ratio.
-
AFluxes of glucose carbon into metabolites of the TCA cycle and its branching pathways. The ratio of fully labeled and unlabeled isotopolog amount is shown for each metabolite as analyzed by targeted metabolomics. The mean of four replicates for each cell line is shown. Error bars indicate the SEM. Statistical significance of one‐way ANOVA: ***P < 0.001.
-
BID8 Trp53‐deleted and Trp53/Brca2‐deleted ovarian tumor cells were incubated for 48 h with complete DMEM in the absence or presence of 5 mM metformin. Cells were then lysed, and total ATP levels are measured as indicated. Data were normalized with respect to protein content. The mean of seven independent experiments is shown. Error bars indicate the SEM. Statistical significance of two‐tailed unpaired Mann–Whitney U‐tests: ID8 Trp53‐deleted versus double Trp53/Brca2‐deleted, ***P = 0.0006; ID8 double Trp53/Brca2‐deleted control versus metformin, ***P = 0.0006.
-
CID8 Trp53‐deleted and Trp53/Brca2‐deleted ovarian tumor cells were incubated for 48 h with complete DMEM in the absence or presence of 5 mM metformin. Cells were then lysed and total NAD+ and total NADH levels measured as indicated. Data were normalized with respect to protein content. Ratios between NAD+ and NADH levels in each situation were calculated. The mean of three (ID8 Trp53‐deleted, 1.45, 1.97, and 1.13 in the absence and 1.63, 0.96, and 1.29 in the presence of metformin) and four independent experiments (ID8 Trp53/Brca2‐deleted 1.93, 1.84, 2.17, and 1.40 in the absence and 1.06, 1.10, 0.99, and 1.06 in the presence of metformin) is shown. Error bars indicate the SEM. Statistical significance of two‐tailed unpaired Mann–Whitney U‐tests: ID8 double Trp53/Brca2‐deleted control versus metformin, *P = 0.0286.
-
DID8 Trp53‐deleted and Trp53/Brca2‐deleted ovarian tumor cells were incubated for 3 days over a range of metformin concentrations in complete DMEM without pyruvate and complete DMEM and 1 mM pyruvate (+Pyr). Cell viability was measured as the frequency of cells stained with crystal violet. The IC50 was determined by representing results relative to the control without metformin. Bars represent the mean and SEM of six independent determinations. Statistical significance of one‐way ANOVA, Tukey's multiple comparisons test, **P < 0.01.
-
EID8 Trp53‐deleted and Trp53/Brca2‐deleted ovarian tumor cells were incubated for 48 h with complete DMEM without pyruvate or complete DMEM and 1 mM pyruvate in the absence or presence of 5 mM metformin. Cells were lysed and immunoblotted using the indicated antibodies. A representative blot of three independent experiments is shown.
-
FID8 Trp53‐deleted (n = 3) and Trp53/Brca2‐deleted (n = 3) ovarian tumor cells were incubated for 2 days in normal DMEM in the absence or presence of 5 mM metformin and in the absence or presence of 1 mM pyruvate. Cells were then lysed and total NAD+ and total NADH levels measured as indicated. Data were normalized with respect to protein content. Ratios between NAD+ and NADH levels in each situation were calculated. Error bars indicate the SEM. Statistical significance of one‐way ANOVA, Tukey's multiple comparisons test, *P < 0.05.
-
GID8 Trp53‐deleted and Trp53/Brca2‐deleted ovarian tumor cells were incubated for 3 days over a range of metformin concentrations in complete DMEM, or in complete DMEM and the indicated concentrations of GMX1777 (nM). Cell viability was measured as the frequency of cells revealed by crystal violet staining. The IC50 was determined by representing results relative to a zero level of inhibitor. Bars represent the mean and SEM of four independent determinations. Statistical significance of two‐tailed unpaired Mann–Whitney U‐tests: ***P = 0.0006.
-
HID8 Trp53‐deleted and Trp53/Brca2‐deleted ovarian tumor cells were incubated for 3 days over a range of metformin concentrations in complete medium without pyruvate, or in complete medium and 1 mM nicotinamide (+Nico). Cell viability was measured as the frequency of cells stained with crystal violet. The IC50 was determined by representing results relative to the control. Bars represent the mean and SEM of six independent determinations. Statistical significance of two‐tailed unpaired Mann–Whitney U‐tests, *P = 0.028.
-
IBox plot showing higher sensibility (i.e., lower standardized half‐maximal inhibitory concentration [IC50]) to the NMPRT inhibitor FK866 in cancer cell lines classified as MSI‐H (high genomic instability, n = 60) relative to MSI stable (MSS) or MSI‐low (MSI‐L; low genomic instability, n = 926). The box plots show a typical display consisting of a median value depicted by the line in the center of the box; an interquartile range (IQR; 25th to the 75th percentile) depicted by the box; the maximum (Q3 + 1.5*IQR) and minimum (Q1 − 1.5*IQR) values depicted by the whisker; and outliers shown as individual circles. The P value of the t‐test is shown.
Source data are available online for this figure.