
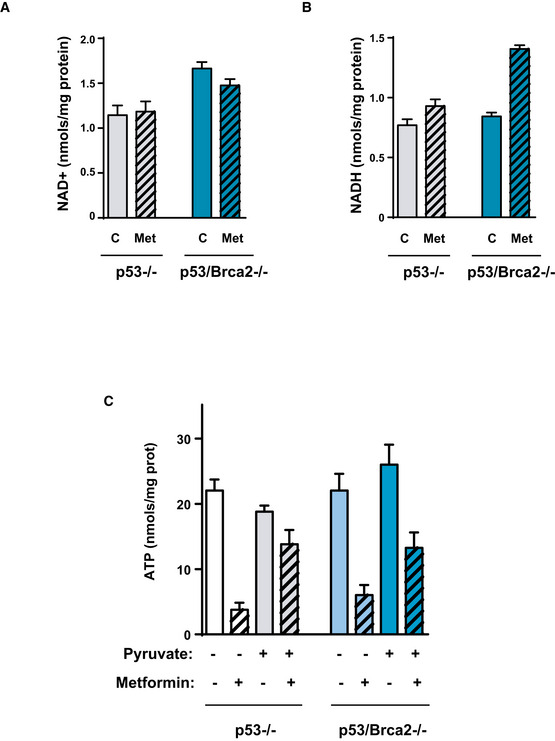
Figure EV5. Effect of metformin on NAD +, NADH, and ATP levels.
-
AID8 Trp53‐deleted and Trp53/Brca2‐deleted ovarian tumor cells were incubated for 48 h with complete DMEM in the absence or presence of 5 mM metformin. Cells were then lysed and total NAD+ levels measured as indicated. Data were normalized with respect to protein content. The mean of four independent experiments is shown. Error bars indicate the SEM.
-
BUsing the same extracts as in (A), total NADH levels were measured as indicated. Data were normalized with respect to protein content. The mean of four independent experiments is shown. Error bars indicate the SEM.
-
CID8 Trp53‐deleted (n = 4) and Trp53/Brca2‐deleted (n = 4) ovarian tumor cells grown for 2 days in normal DMEM in the absence or presence of 2 mM metformin and in the absence or presence of 1 mM pyruvate. Cells were then lysed and total ATP levels measured as indicated. Data were normalized with respect to protein content. Error bars indicate the SEM.