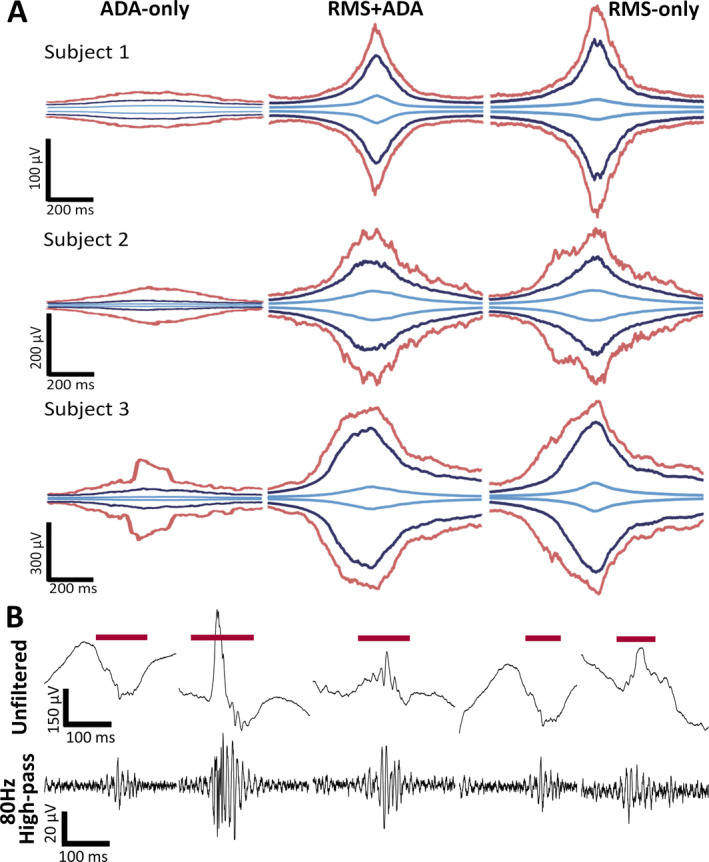
FIGURE 3.

A, Amplitude envelopes of detected events separated into ADA‐only (left panel), RMS + ADA (center panel), and RMS‐only (right panel) from three representative subjects. The maximum, 95th percentile, and median amplitude envelope are represented by red, blue, and light blue lines, respectively. B, Examples of ADA‐only events
