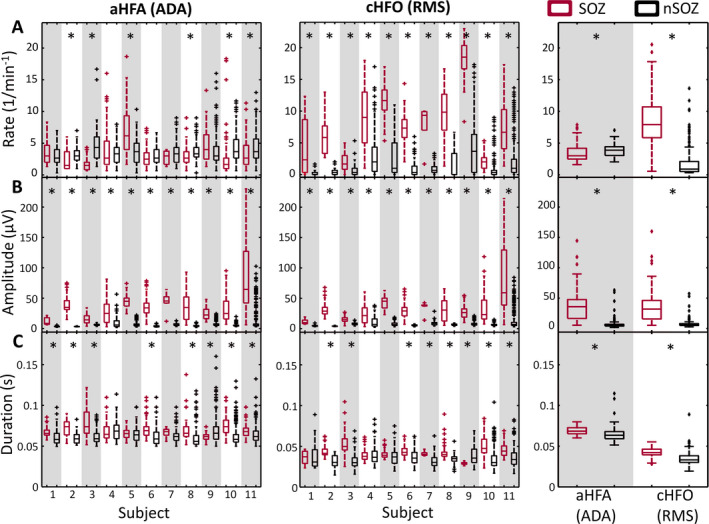
FIGURE 4.

Characteristics of detected events separated into SOZ (red) and nSOZ channels (black). Boxplots show the (A) rate, (B) amplitude, and (C) duration of detected events for individual subjects (aHFA in left column and cHFO in middle column) and overall characteristics of detected events when all segments are pooled together (right column). *P‐value < .0045, Wilcoxon rank‐sum test with Bonferroni correction for 11 subjects
