FIGURE 6.

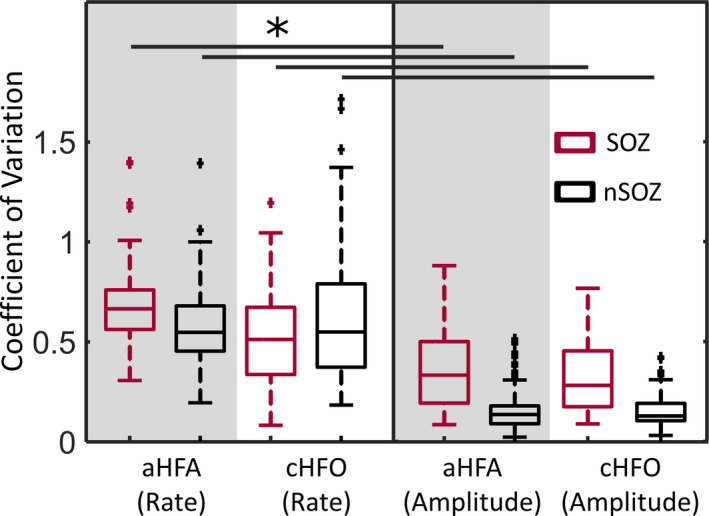
Boxplots of CV for the rate and amplitude of detected events, separated into SOZ (red) and nSOZ (black). *P‐value < .0125, Wilcoxon rank‐sum test

Boxplots of CV for the rate and amplitude of detected events, separated into SOZ (red) and nSOZ (black). *P‐value < .0125, Wilcoxon rank‐sum test