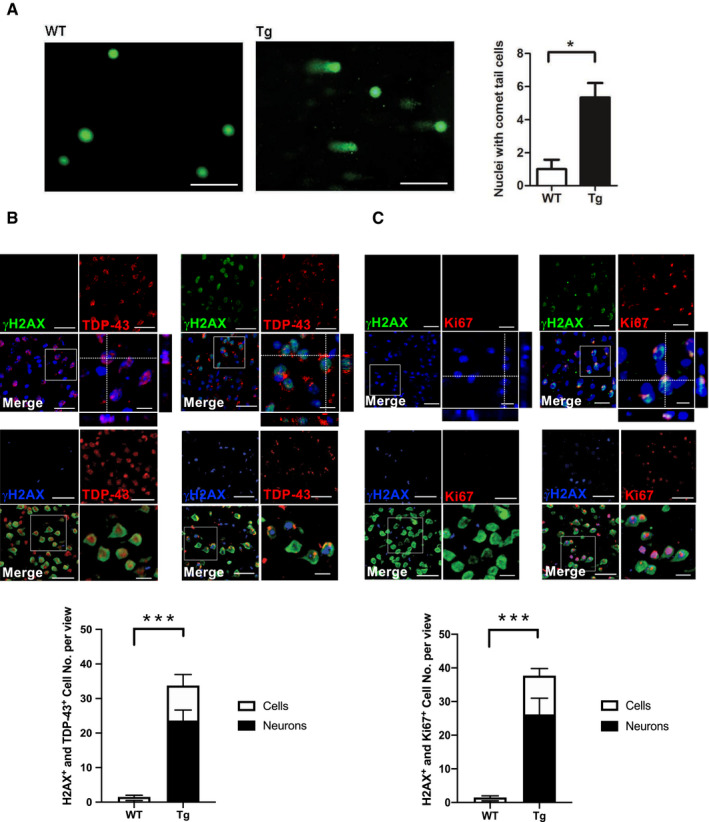
Figure 2. DNA damage correlates with TDP‐43 proteinopathies in FTLD‐TDP Tg mice.

-
ARepresentative image of comet assay for DNA fragmentation and the quantification of cells with comet tails in the regions of frontal cortices from 6‐mon‐old WT and FTLD‐TDP Tg mice. Scale bar: 50 μm. n = 9 sections per mouse, N = 5 mice per group, data are presented as mean ± SEM, *P = 0.0114 by t‐test.
-
BRepresentative IF staining of γH2AX and TDP‐43 in the regions of frontal cortices from 6‐mon‐old WT and FTLD‐TDP Tg mice. Nuclei were stained with DAPI (upper panel in blue) or NeuN (middle panel in green). Scale bar: 50 μm. The circled area is emphasized for showing the distribution of immunoreactivity in cell subregions. Scale bar: 15 μm. Lower panel: quantification of cells or neurons with γH2AX immunoreactivity and TDP‐43 proteinopathies from each view of microscope. n = 9 sections per mouse, N = 5 mice per group, data are presented as mean ± SEM, ***P = 0.0008 by t‐test.
-
CRepresentative IF staining of γH2AX and Ki67 in the regions of frontal cortices from WT and FTLD‐TDP Tg mice. Nuclei were stained with DAPI (upper panel) or NeuN (middle panel). Scale bar: 50 μm. Subregions, scale bar: 15 μm. Lower panel: quantification of cells or neurons with γH2AX and Ki67 immunoreactivity from each view of microscope. n = 9 sections per mouse, N = 5 mice per group, data are presented as mean ± SEM, ***P = 0.0004 by t‐test.
Source data are available online for this figure.
