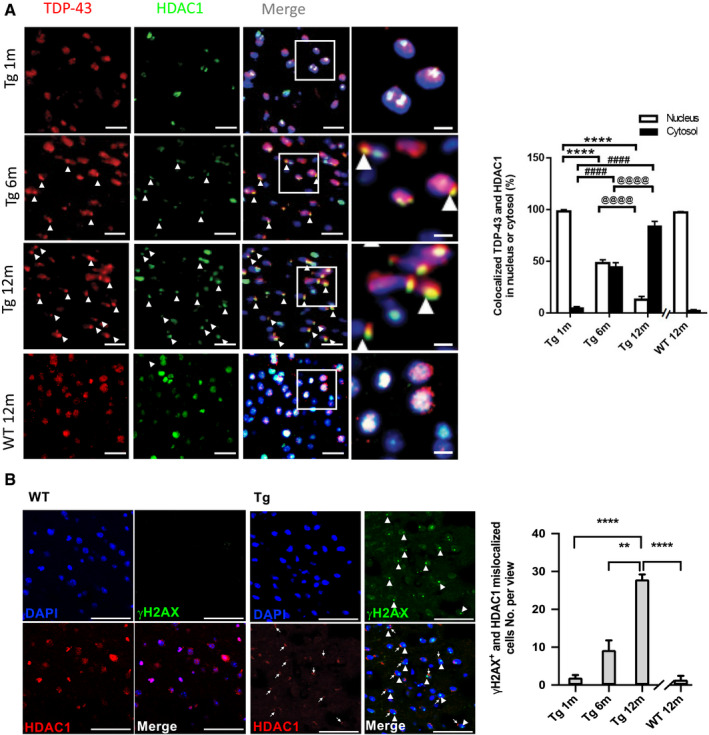
Figure 4. HDAC1 mislocalization correlates with pathogenesis of TDP‐43 proteinopathies in FTLD‐TDP Tg mice.

-
ALeft graph: IF staining of TDP‐43 and HDAC1 during progression of TDP‐43 proteinopathies in the frontal cortices from the FTLD‐TDP Tg and WT mice. Nuclei were stained with DAPI (in blue). Scale bar: 50 μm. The circled area is emphasized for showing the distribution of immunoreactivity in cell subregions. Scale bar: 15 μm. Right histogram: Quantification of co‐localized TDP‐43 and HDAC1 immunoreactivity in the cytosol or nucleus in the WT or 1‐, 6‐, and 12‐month‐old FTLD‐TDP Tg mice. n = 9 sections per mouse, N = 5 mice per group, data are presented as mean ± SEM. *Nucleus: Tg 1 m versus Tg 6 m or 12 m; #Cytosol: Tg 1 m versus Tg 6 m or 12 m; @ Tg 6 m versus Tg 12 m. ****/####/@@@@ P < 0.0001 by multiple comparison.
-
BLeft graph: IF staining of γH2AX and HDAC1 in the frontal cortices from the 12‐month‐old FTLD‐TDP Tg and WT mice. Nuclei were stained with DAPI (in blue). Arrowhead: γH2AX+ nucleus; arrow: mislocalized HDAC1. Scale bar: 50 μm. Right histogram: Quantification of γH2AX+ and HDAC1 mislocalized cells in the WT or 1‐, 6‐, and 12‐month‐old FTLD‐TDP Tg mice. n = 4 sections per mouse, N = 5 mice per group, data are presented as mean ± SEM. **P = 0.0079, ****P < 0.0001 by multiple comparison.
Source data are available online for this figure.
