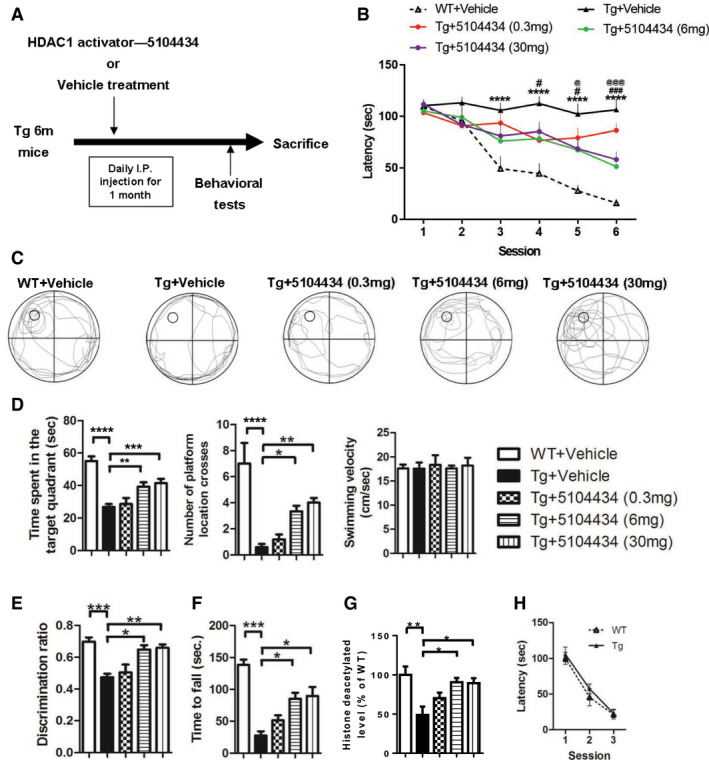
Figure EV4. Therapeutic potential and dose evaluation of compound 5104434 for treating cognitive and motor deficits in FTLD‐TDP Tg mice.

-
ASchematic diagram shows the protocol used for HDAC1 activator compound 5104434 treatment and behavioral tests. Three doses were tested for 1 month to determine the optimum therapeutic dose.
-
BEscape latency of mice in Morris water maze task. N = 6 mice per group, *WT+Vehicle mice versus Tg+Vehicle mice, #Tg+5104434 (6 mg) mice versus Tg+Vehicle mice. @Tg+5104434 (30 mg) mice versus Tg+Vehicle mice. Statistical analysis by two‐way ANOVA with Bonferroni's multiple comparisons. #/@ P < 0.05, ###/@@@ P ≤ 0.001 and ****P ≤ 0.0001. Exact P values are shown in Appendix Table S1.
-
CRepresentative searching path of mice in the probe test.
-
DScores of mice as per the number of times the hidden platform was crossed, time spent searching in the target quadrant, and the velocity of swimming in the probe test at 24 h after escape training. N = 6 mice per group. Statistical analysis by one‐way ANOVA with Tukey's multiple comparisons. *P < 0.05, **P ≤ 0.01; ***P ≤ 0.001 and ****P ≤ 0.0001. Exact P values are shown in Appendix Table S1.
-
EScores of the discrimination index in the novel object recognition test. N = 6 mice per group. Statistical analysis by one‐way ANOVA with Tukey's multiple comparisons. *P < 0.05, **P ≤ 0.01; ***P ≤ 0.001. Exact P values are shown in Appendix Table S1.
-
FScores of mice in the rotarod test. N = 6 mice per group. *P = 0.0482 (6 mg)/0.0392 (30 mg), ***P = 0.0001 by multiple comparison.
-
GNuclear HDAC1 activity in mice following 1 month of 5104434 treatment. N = 6 mice per group. *P = 0.0117 (6 mg)/0.0151 (30 mg), **P = 0.0016 by multiple comparison.
-
HVisible platform test in WT and FTLD‐TDP Tg mice. N=6 mice per group.
