-
A
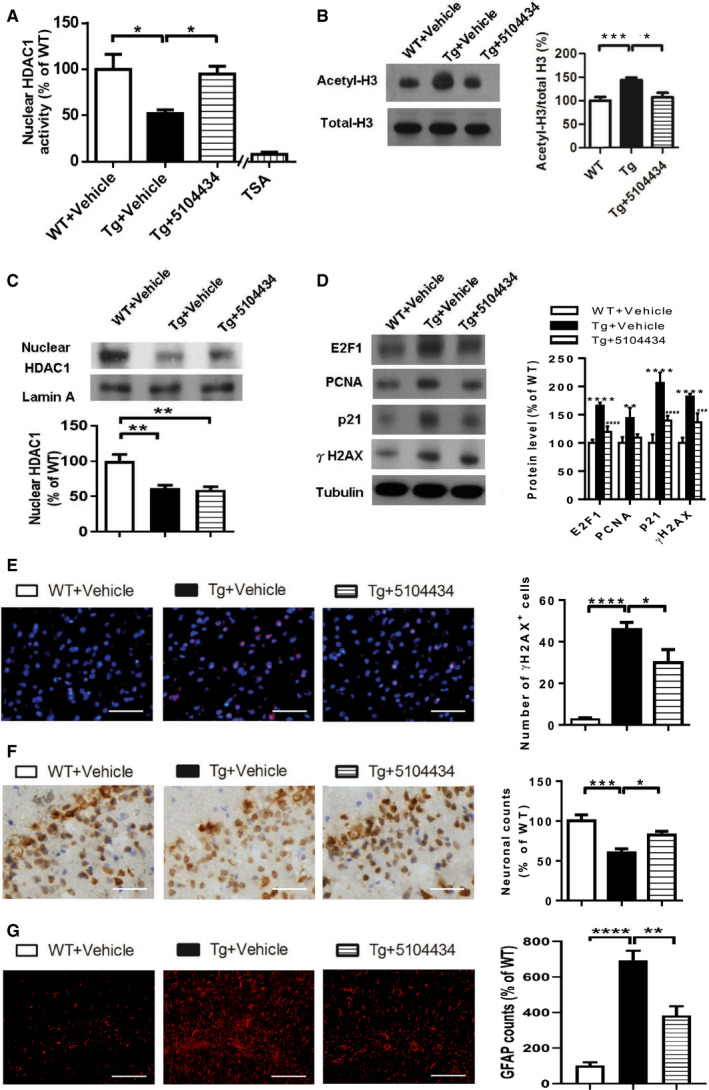
Nuclear HDAC1 activity in mice after 2 months of compound 5104434 treatment. The nuclear extracts of the frontal cortices and hippocampus from 8 months old of mice were separated from total tissue lysates, were immunoprecipitated for HDAC1, and were then conducted to HDAC1 activity assay. N = 6 mice per group. TSA: nuclear extracts that were treated with Trichostatin A (TSA, an HDAC inhibitor) as a negative control for HDAC1‐transferred fluorescent activity during the HDAC1 activity assay. *P = 0.0203 (WT versus Tg‐Veh) or 0.0408 (Tg‐Veh versus Tg+5104434) by multiple comparison.
-
B
Representative data of Western blot for nuclear acetylated‐histone 3 (Lys 9/14), total histone H3, and quantification of protein levels. N = 6 mice per group. *P = 0.0105 or ***P = 0.0008 by multiple comparison.
-
C
Representative data of Western blot for nuclear HDAC1 levels and semi‐quantification of the expression levels. N = 6 mice per group. **P = 0.0022 (Tg)/0.0012 (Tg+5104434) by multiple comparison.
-
D
Left panel: representative data of Western blot for cell cycle‐related and DNA damage‐related proteins. Right histogram: semi‐quantification of protein levels.
N = 6 per group. *WT+Vehicle mice versus Tg+Vehicle mice,
#Tg+5104434 mice versus Tg+Vehicle mice. Statistical analysis by multiple
t‐test with FDR correction, Q = 1%. **
P ≤ 0.01;
###
P ≤ 0.001 and ****/
####
P ≤ 0.0001. Exact
P values are shown in
Appendix Table S1.
-
E
IF staining of γH2AX in the frontal cortices and quantification of the immunoreactive cells from 8 months old of WT+Vehicle, Tg+Vehicle, Tg+5104434. n = 9 sections per mouse, N = 6 mice per group. Scale bar: 50 μm. *P = 0.0421 or ****P < 0.0001 by multiple comparison.
-
F
Immunohistochemistry of NeuN and the quantification of the immunoreactive cells in the hippocampus of three groups of mice, 8‐mon‐old WT+Vehicle, Tg+Vehicle, and Tg+5104434. n = 9 sections per mouse, N = 6 mice per group. Scale bar: 50 μm.*P = 0.0414 or ***P = 0.0006 by multiple comparison.
-
G
IF staining of GFAP and the quantification of the immunoreactive cells in the hippocampus of three groups of mice, 12‐month‐old WT+Vehicle, Tg+Vehicle, and Tg+5104434. n = 9 sections per mouse, N = 6 mice per group. Scale bar: 50 μm. **P = 0.002 and ****P < 0.0001 by multiple comparison.
Data information: All data are presented as mean ± SEM (%) except for (E, G) where number of cells in each view is presented.

