-
A
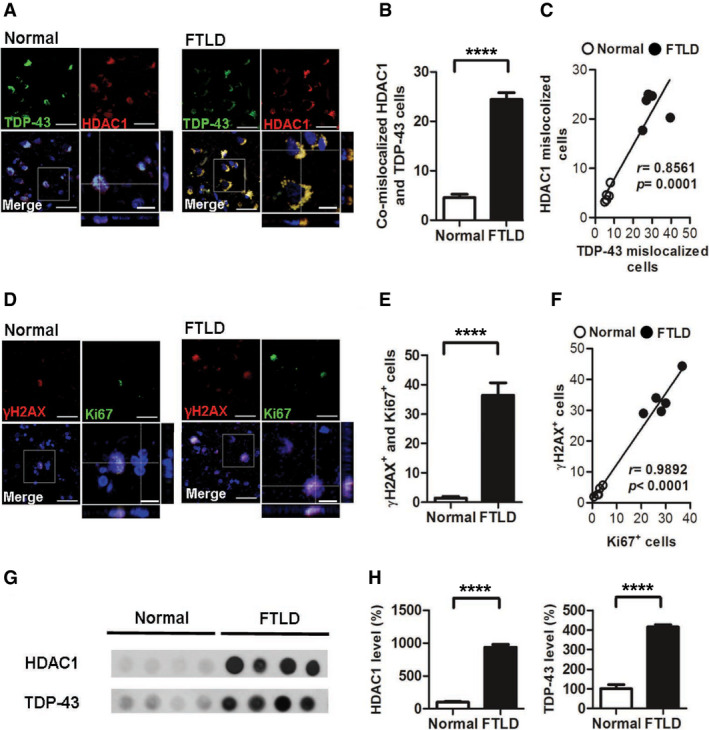
Representative IF staining of TDP‐43 and HDAC1 in the frontal cortices from normal individuals and patients with FTLD‐TDP. Scale bar: 50 μm. The circled area is emphasized for showing the distribution of immunoreactivity in cell subregions. Scale bar: 15 μm.
-
B
Quantification of cells with co‐mislocalized HDAC1 and TDP‐43 from each view of microscope. N = 5 per group.
-
C
Linear regression analysis of cells with HDAC1 mislocalization and TDP‐43 proteinopathies. Total cell counts: 3,000 per samples. P = 0.0001 by Pearson correlation analysis.
-
D
Representative IF staining of γH2AX and Ki67 in the frontal cortices from normal individuals and patients with FTLD‐TDP from each view of microscope. Scale bar: 50 μm. The circled area is emphasized for showing the distribution of immunoreactivity in cell subregions. Scale bar: 15 μm.
-
E
Quantification of cells with γH2AX and Ki67 immunoreactivity. N = 5 per group.
-
F
Linear regression analysis of cells with DNA damage and aberrant cell cycle activity. Total cell counts: 3,000 per samples. P < 0.0001 by Pearson correlation analysis.
-
G
Dot blot of HDAC1 and TDP‐43 in urea‐soluble fractions from the frontal cortex of normal individuals and patients with FTLD‐TDP.
-
H
Quantification of HDAC1 and TDP‐43 expression levels in urea‐soluble fractions. N = 5 per group.
‐test.

