-
A
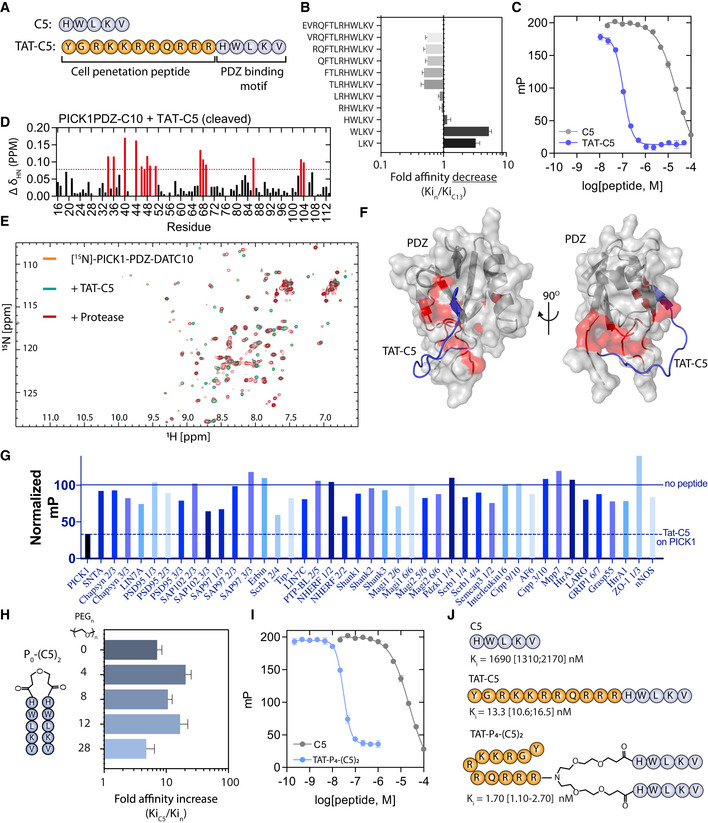
Primary sequence of 5‐mer peptide (C5) derived from the dopamine transporter C‐terminus and the Tat‐conjugated variant, Tat‐C5.
-
B
Fluorescence polarization (FP) competition derived affinity assessment of consecutive truncations of the DAT C13 C‐terminus as indicated by the sequences. Bars indicate the mean fold change relative to C13 (
K
i = 1.69 μM). Data are shown as mean with error bars as SEM with
n = 6. Representative binding curves are shown in Fig
EV1A.
-
C
FP competition binding of C5 and Tat‐C5 to PICK1 with 5FAM‐Tat‐C5 (20 nM) as tracer. Saturation binding curve is shown in Fig
EV1B.
-
D
Backbone amide chemical shift changes (Δδ
HN) of PICK1‐PDZ‐C10 after addition of Tat‐C5 and addition of protease to cleave C10 from the PDZ domain and allow exchange. Numbers refer to residue number in PICK1 (UniProt:
Q9EP80). Red bars indicate a chemical shift larger than mean+SD.
-
E
1H‐15N‐HSQC 2D spectra of PICK1‐PDZ‐C10 (orange) following addition of Tat‐C5 (green) and subsequent addition of protease (red) to allow for exchange between C10 and Tat‐C5.
-
F
Docking model, for visual purposes, of PICK1‐PDZ (PDB: 2LUI) in complex with Tat‐C5 (blue), with perturbed residues indicated from (D) in red.
-
G
Selectivity screen for Tat‐C5 against a selection of 42 purified PDZ domains performed with a fixed concentration of Tat‐C5 (10 μM) in competition with PDZ domains and their respective fluorescent ligands. Data are normalized to binding in absence of peptide (full line). Dashed line represents the level of competition obtained for PICK1. Screen for C5 can be seen in Fig
EV1C.
-
H
Affinity gain of bivalent C5 peptides (P
n‐(C5)
2) N‐terminally conjugated with different length PEG linkers as indicated. Bars indicate the mean fold change relative to C5 (
K
i = 1.69 μM). Data are shown as mean with error bars as SEM with
n = 6. Representative binding curves are shown in Fig
EV1C.
-
I
FP competition binding of C5 (also used in C) and Tat‐P4‐(C5)2 to PICK1 with 5FAM‐Tat‐C5 (20 nM) as tracer.
-
J
Structure and highest obtained affinity of C5, Tat11‐C5, and Tat11‐P4‐(C5)2 toward PICK1.
Data information: Data points and bars are shown as mean with error bars as SEM of
n ≥ 3. Docking in (F) was done using HADDOCK (van Zundert
et al,
2016), with residues indicated from (D) as essential residues for interaction, but no further restraints, therefore being only for visual purposes.

