-
A
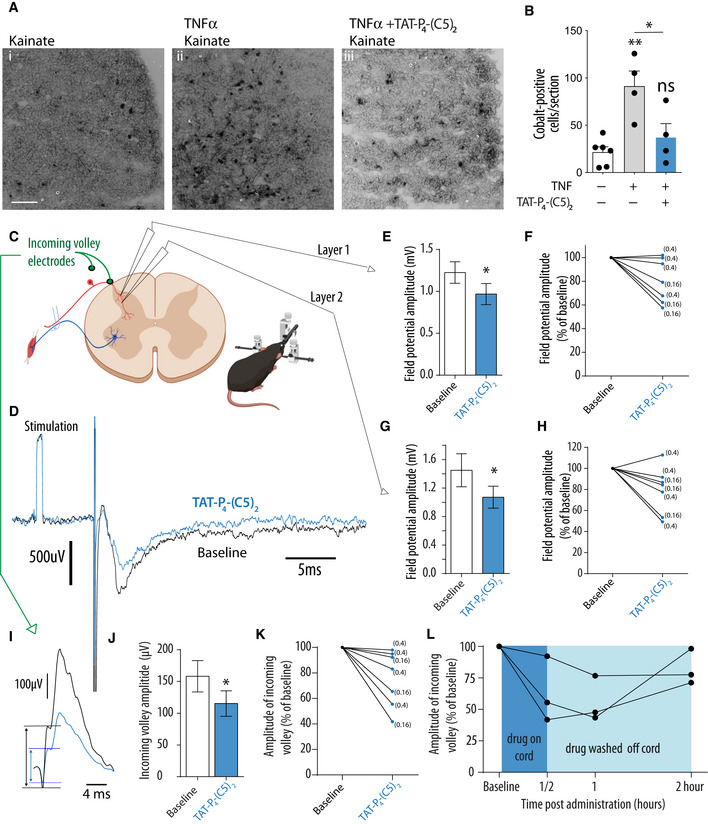
Representative images of kainate‐induced cobalt uptake in spinal cord slices from p14 mouse pups treated with (i) saline, (ii) TNFα, and (iii) TNFα + Tat‐P4‐(C5)2. Scale bar: 100 μm.
-
B
Quantification of cobalt positive (black soma) cells. Each data point represents the average of 4‐6 25‐μm sections from a single 400 μm slice. Bars show means of 4–6 slices, and error bars represent SEM (one‐way ANOVA followed by Bonferroni's multiple comparison test, *P < 0.05, **P < 0.01).
-
C
In vivo electrophysiological recordings for the dorsal spinal cord before and after peptide administration following stimulation of the peripheral sural nerve at intensities sufficient to activate C and Aδ fibers. Illustration of the experimental setup indicates where measurements were made (image made using Biorender.com).
-
D
Example of field potentials recorded in the same position before (black) and after (blue) peptide administration. The recording starts with a 1 mV calibration pulse followed by a stimulus artifact (S), which is truncated for the figure and finally the field potential at a depth corresponding to lamina 1. Each trace is an average of at least 10 successive trials.
-
E
Bar chart showing the mean amplitude of the field potential at lateral positions in lamina 1 recorded before and approximately 30 min after peptide administration, which was significantly reduced (Wilcoxon matched pairs, *P = 0.0313, W = −26, n = 7 mice, error bars: SEM).
-
F
Line chart to show data from (E), as separate data points for individual mice expressed as a percentage relative to baseline measurements. From this, it can be seen that the response was variable across mice with just over half showing a large reduction and the remaining mice only showing a relatively minor reduction (with no reduction in one mouse). The von Frey thresholds for the individual mice before the experiment are shown next to each line.
-
G
Bar chart showing the mean amplitude of the field potential at lateral positions in lamina 2 recorded before and 30 min after peptide administration, which was significantly reduced (Wilcoxon matched pairs, *P = 0.0313, W = −26, n = 7 mice, error bars: SEM).
-
H
Line chart to show data from (G), as separate data points for individual mice expressed as a percentage relative to baseline measurements. From this, it can be seen there was reduction in all but 1 mouse, although the magnitude of the reduction was again variable across mice. The von Frey thresholds for the individual mice before the experiment are shown next to each line.
-
I
Example of cord dorsum potentials recorded following stimulation of the peripheral sural nerve. The initial 3 inflections represent the incoming volley of action potentials along the afferent axons just before they enter the spinal cord. This was recorded before (black) and again 30 min post‐peptide administration (blue). In this particular example, an extreme drop in the amplitude of the incoming volley is observed post‐administration.
-
J
Bar chart showing that the mean amplitude of the incoming volley is reduced post‐administration (Wilcoxon matched pairs, *P = 0.0156, W = −28, n = 7 mice, error bar: SEM).
-
K
Line chart to show data from (J), as separate data points for individual mice expressed as a percentage relative to baseline measurements. From this, it can be seen that the response was variable across mice with half showing a large reduction and the remaining mice only a minor reduction.
-
L
Amplitude of the incoming volley expressed as a percentage of the baseline recording prior to peptide administration. In these 3 mice, a reduction in the incoming volley at 30 min post‐administration is seen. After this recording, the remaining peptide was removed by washing the spinal cord and two further recordings made at 1 and 2 h. Here, it can be seen that the incoming volley does not deteriorate further but stabilizes or starts to return toward baseline levels confirming that the initial reduction was not due to a deterioration in the health of the animal or damage to the roots.

