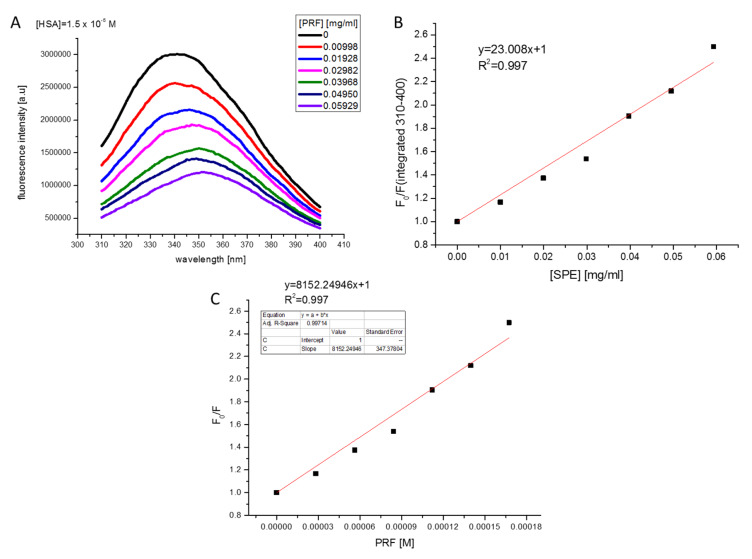
Figure 12.
Fluorescence spectrum of HSA (1.5 × 10⁻⁵ M, excitation at 295 nm) and its changes upon increasing concentrations of the PRF extract (A). Stern–Volmer plot for HSA quenching by PRF (concentration of PRF in mg/mL) (B). Stern-Volmer plot for HSA quenching by PRF (concentration of PRF in expressed as chlorogenic acid equivalent [M]) (C).

