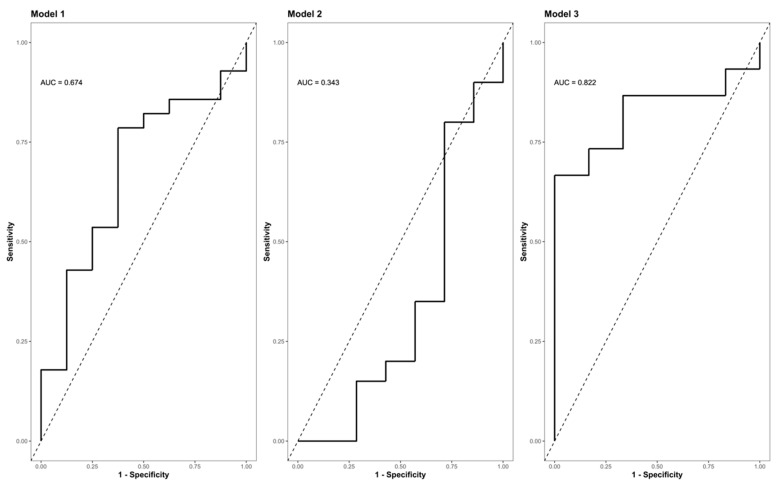
Figure 6.
ROC (Receiver Operator Characteristic) curve analysis of the final model II indicating its AUC (area under the curve) and the corresponding confidence interval (CI) for predicting the presence or absence of neurological impairment as a function of the difference in the Zn concentration (0 h–9 h). Model I (S/C ~ Zn 0 h [µg/L]); model II (S/C ~ Zn 9 h [µg/L]); (S/C ~ Zn 0 h–9 h [µg/L]). Abb.: S/C = criterion presence or absence of a neurological impairment (study group S vs. control group C); Zn 0 h [µg/L] = Zn concentration at admission/0 h after injury; Zn 9 h [µg/L] = Zn concentration 9 h after injury; Zn 0 h–9 h [µg/L] = difference in the Zn concentration 0 h–9 h after injury; AUC = area under the curve.

