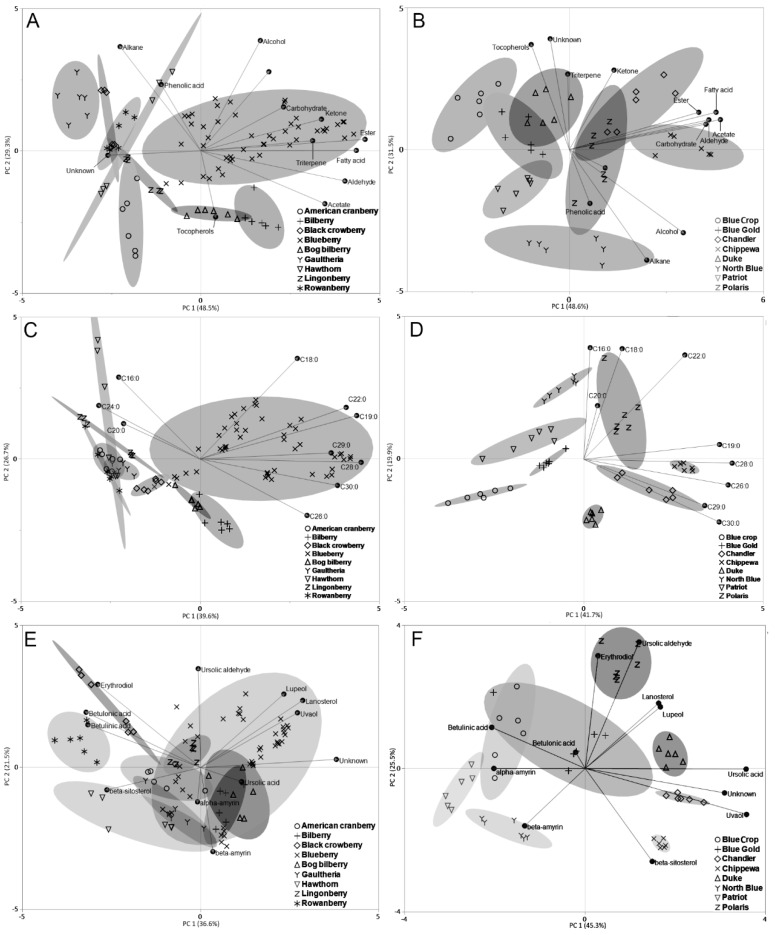
Figure 3.
Principal components analysis (PCA) using cuticular wax quantitative analysis of tested berry species and varieties. (A) and (B) show the PCA scores and loadings plot of different compound groups found in the cuticular wax of tested berry species (A) and the different varieties of blueberries (B). (C) and (D) show the PCA scores and loadings plot of the fatty acids found in the cuticular wax extracts of tested berry species (C) and the different varieties of blueberries (D). (E) and (F) show the PCA scores and loadings plot of the fatty acids found in the cuticular wax extracts of tested berry species (E) and the different varieties of blueberries (F). Berries of the same species or variety are grouped by 95% confidence ellipses.

