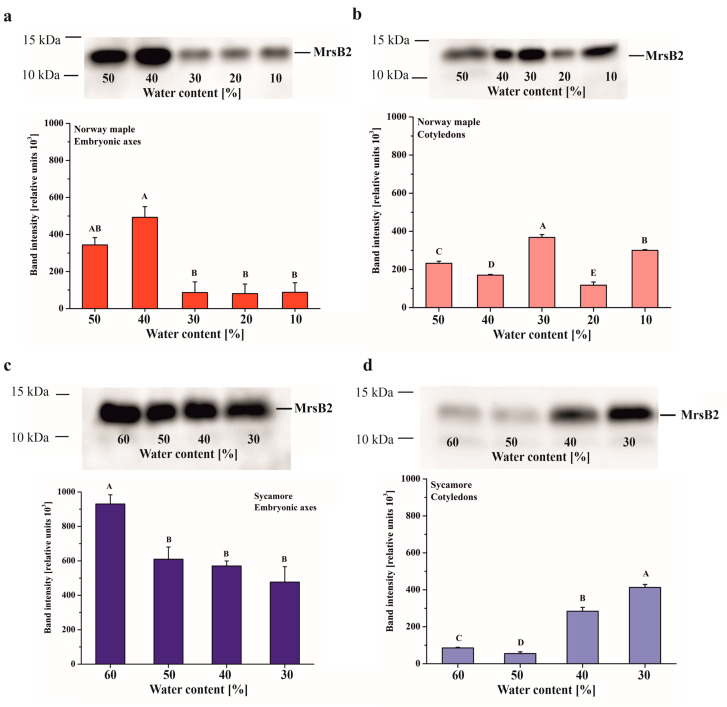
Figure 4.
Immunoblot analyses and densitometric analysis of MsrB2 proteins in the embryonic axes (a, c) and cotyledons (b, d) of Norway maple (a, b) and sycamore (c, d). The data are the means of three independent replicates ± the STDs. The same letters indicate groups that are not significantly different according to Tukey’s test.

