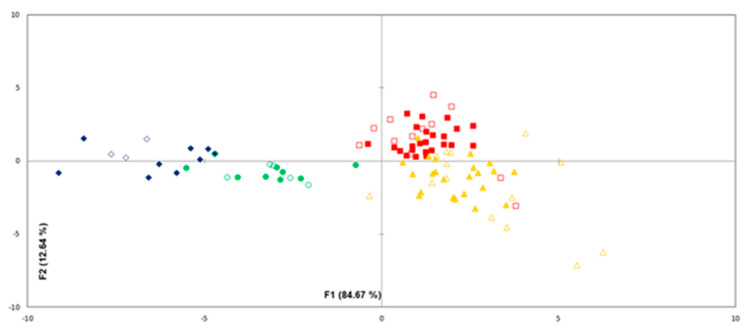
Figure 4.
Discriminant analysis similarity map for the different microbial groups (♦): sterile meat, (▲): meat inoculated with microbial species of pseudomonads, (■): meat inoculated with microbial species of LAB and (●): meat inoculated with a cocktail culture of 4 strains stored at 4 and 10 °C, as determined by the first two discriminant functions. Empty and filled symbols indicate the validation and training samples, respectively.

