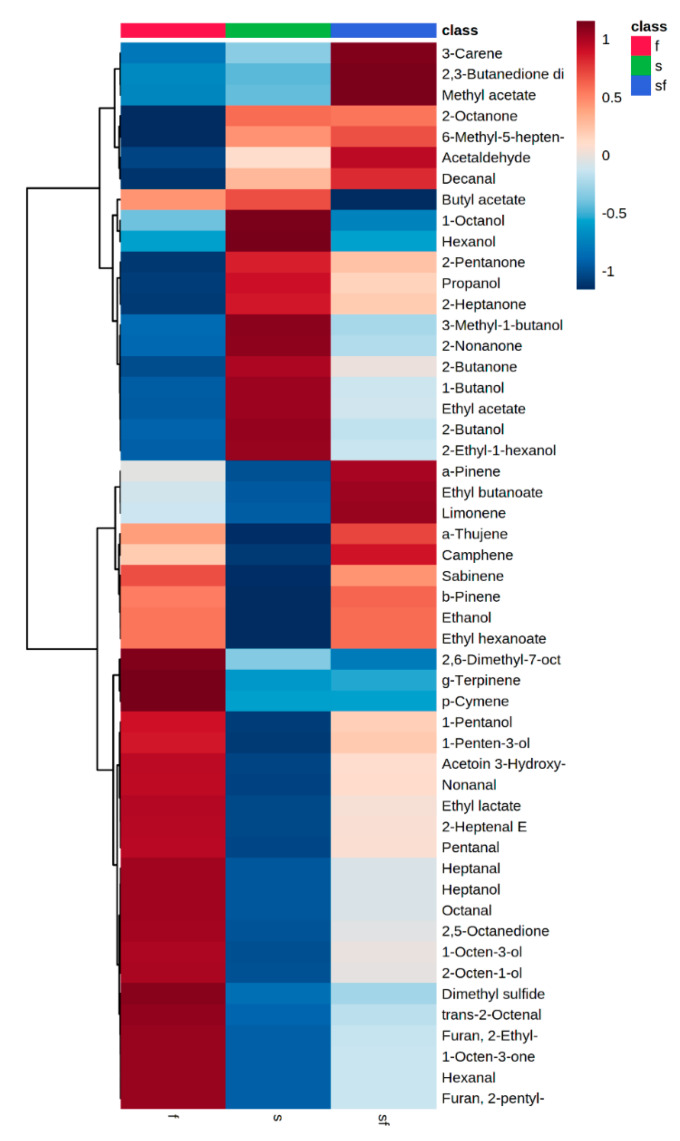
Figure 5.
Heatmap of the volatiles clustered into 3 sensory classes of the sterile and inoculated meat samples during storage at 4 and 10 °C. Ward-linkage clustering was based on the Euclidean correlation coefficients of the 51 volatiles identified in the different sensory classes. The color scale represents the scaled abundance of each variable, with red indicating high abundance and blue indicating low abundance. Columns are colored according to the sensory class: fresh (red), semi-fresh (blue) and spoiled (green).

