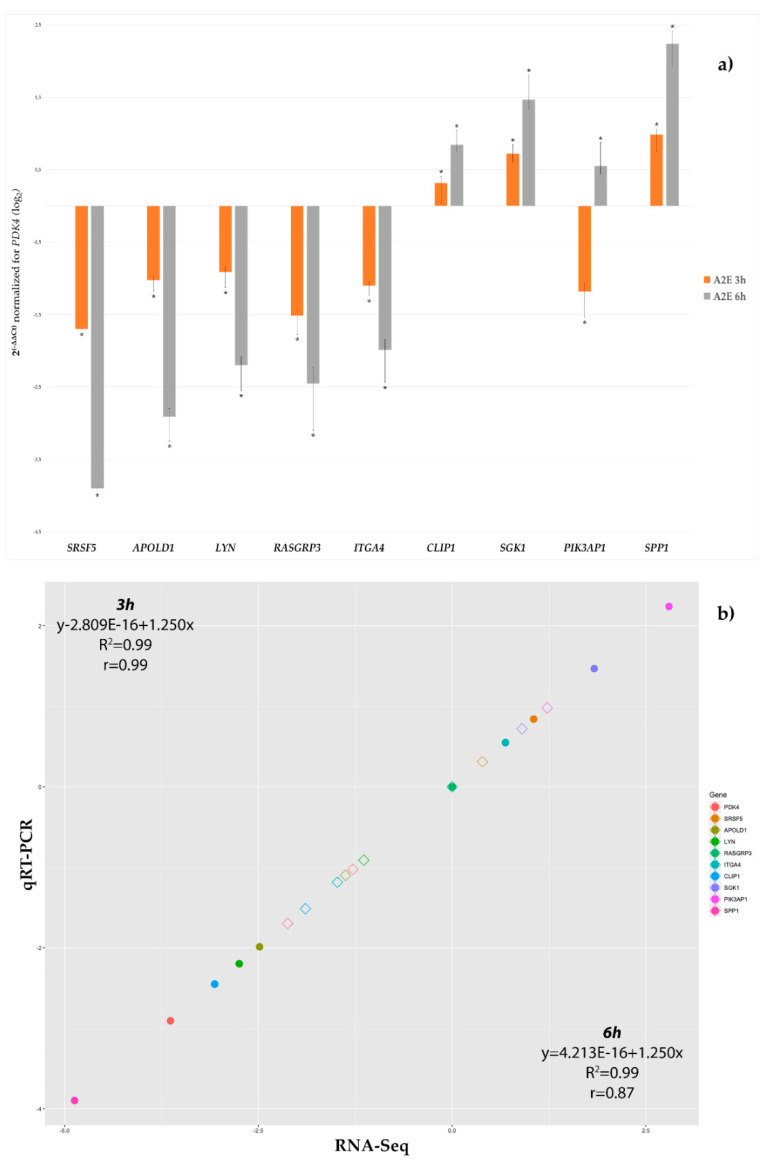
Figure 3.
qRT-PCR validation of the ten most differentially expressed genes. (a) Histograms show the mean expression values (n° of replicate for each group = 6) of nine chosen differentially expressed genes produced by qRT-PCR experiments, resulting after application of the 2−ΔΔCt method, normalized to the best stable gene RASGRP3 (not shown) and control group. Computed results were statistically significant (ANOVA Bonferroni-corrected p-values < 0.01). (b) Correlation plot between RNA-Seq log2FC and qRT-PCR log2FC data, as mean of all considered replicates, confirmed the RNA-Seq result validity. Empty Diamond = RNA-Seq log2FC value for that gene at 3 h (3 h vs. basal time). Full circle = qRT-PCR log2FC value for that gene at 6 h (6 h vs. basal time).

