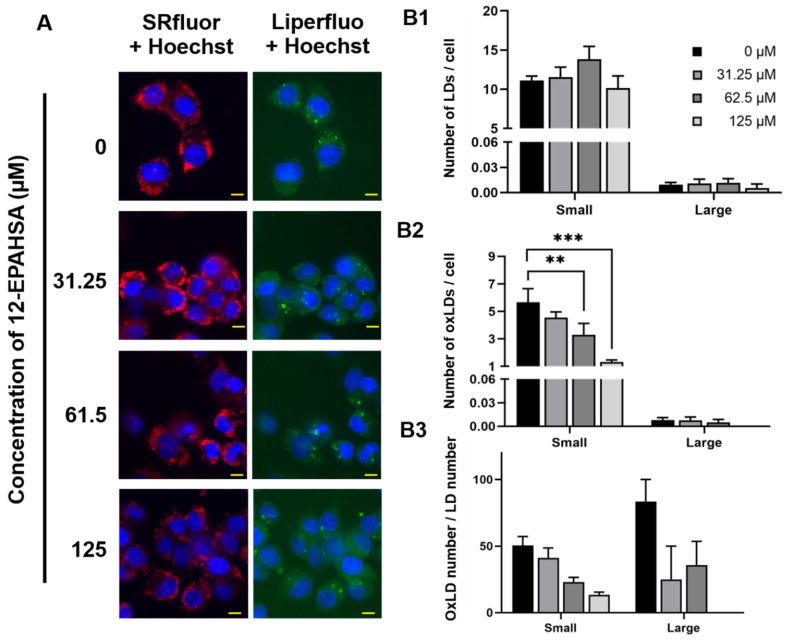
Figure 2.
Effect of 12-EPAHSA on oxidation of LA-induced LDs in C3A cells. Fluorescent images showed neutral lipid (red), lipid peroxide (green) and nuclei (blue) (A). The scale bar shown in each image is 10 µm. To quantify the number of total LDs and oxLDs, fluorescent images were analyzed with ImageJ software. The results are presented as the number of total LDs (B1), the number of oxLDs (B2), and degree of oxidation (B3) for small (< 3 µm2) and large (≥ 3 µm2) LDs. Columns and bars represent the mean ± SEM (n = 3). ** p < 0.01, *** p < 0.001.

