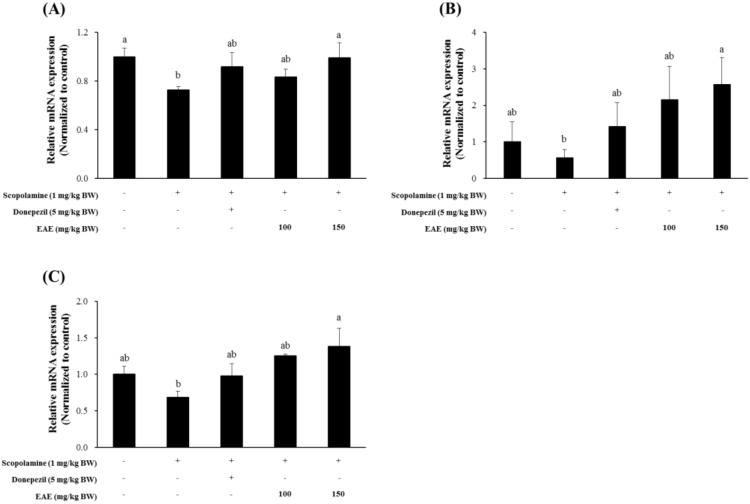
Figure 5.
Effects of EAE on the mRNA expression of the BDNF (A), GDNF (B), and NMDA receptor (C) genes in the mouse hippocampus. Results are expressed as mean ± SD (n = 3). Statistical analysis was performed using one-way ANOVA, following Duncan’s multiple range test. Bars not sharing common alphabetical letters (a,b) represent significant differences from each other (p < 0.05).

