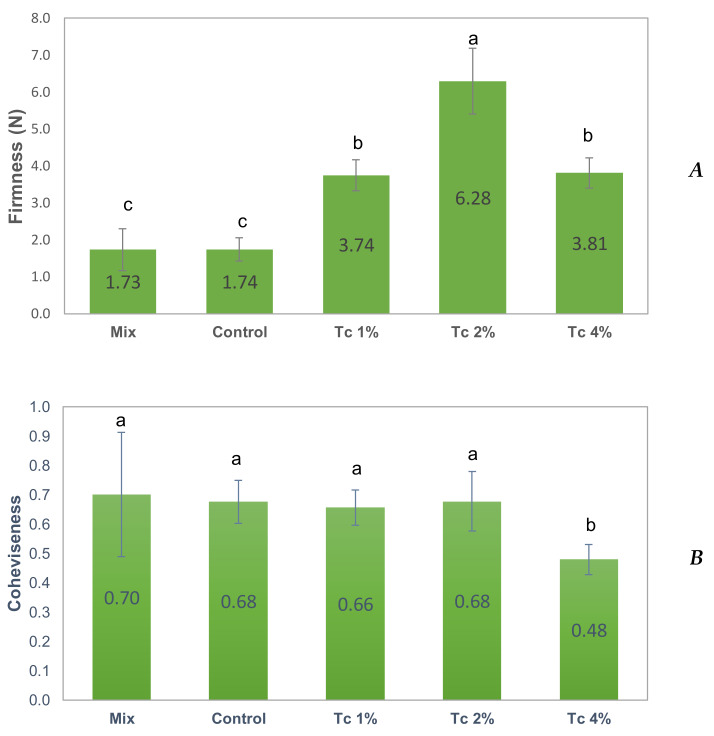
Figure 4.
Firmness (A) and cohesiveness (B) values of GF doughs with T. chuii obtained by the texturometer. Mix, Control and GF dough with T. chuii Tc 1%, Tc 2% and Tc 4%. Error bars indicate the standard deviations from the repetitions (n = 6). Different letters in the same graph correspond to significant differences (p < 0.05).

