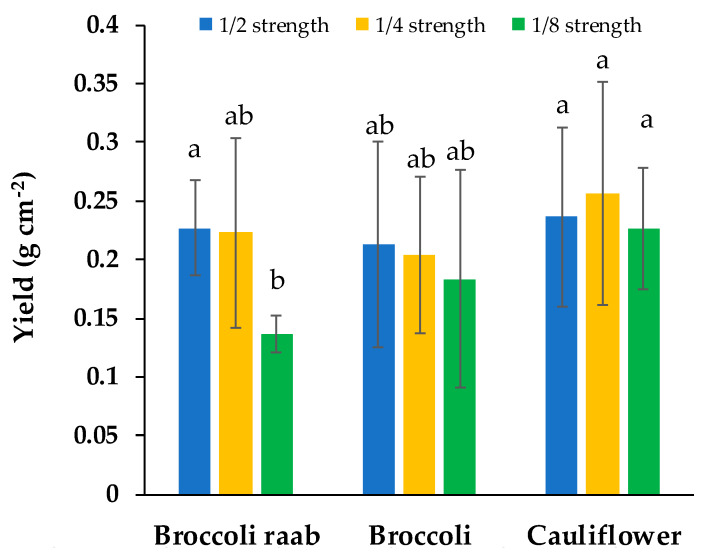
Figure 2.
Yield of three genotypes of microgreens grown with three NS strengths: 1/2 strength, 1/4 strength and 1/8 strength (first experiment). Different letters indicate that mean values are significantly different, according to the SNK test (p = 0.05). Vertical bars represent ± standard deviation of mean values.

