
Table 2.
Results from the different analysis of the orange by-product flour produced.
| Analysis/Component | Value | |
|---|---|---|
| Chemical composition | Water content (g/100 g of DM *) | 10.38 ± 0.36 |
| Protein (g/100 g of DM) | 5.94 ± 0.1 | |
| Fat (g/100 g of DM) | 0.33 ± 0.1 | |
| Ash (g/100 g of DM) | 2.72 ± 0.02 | |
| Dietary fiber (g/100 g of DM) | 73.61 | |
| Glycidic fraction (g/100 g of DM) | 80.63 | |
| Antioxidant properties | Phenolic compound (mg GAE/100g of DM) ** | 534 ± 30 |
| FRAP (µmolTEq/100 g of DM) *** | 93 ± 5 | |
| ORAC (µmolTEq/100 g of DM) *** | 11,728 ± 541 | |
| Functional properties | WAI (g of water/g of DM) | 13.28 ± 0.50 |
| OAI (g of oil/g of DM) | 2.78 ± 0.02 | |
| WSI (%) | 9.94 | |
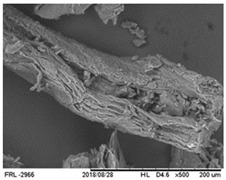
| Microstructure | SEM image at 500× magnification |
|
* DM, dry matter; ** GAE, gallic acid equivalent; and *** TE, trolox equivalent.