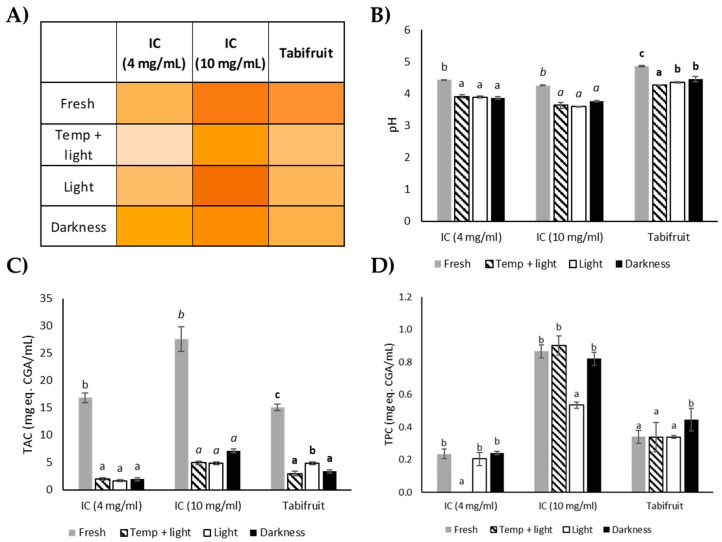
Figure 1.
Photosensitivity and heat resistance of IC at 4 mg/mL, IC at 10 mg/mL and Tabifruit. (A) Color differences (colorizer.org as a tool for color generation [34]); (B) pH; (C) Total antioxidant capacity (TAC) determined by ABTS; (D) Total phenolic content (TPC). Bars represent the mean values and the error bars denote the standard deviation. Different letters on bars indicate significant differences in each beverage sample (Tukey Test, p < 0.05).

