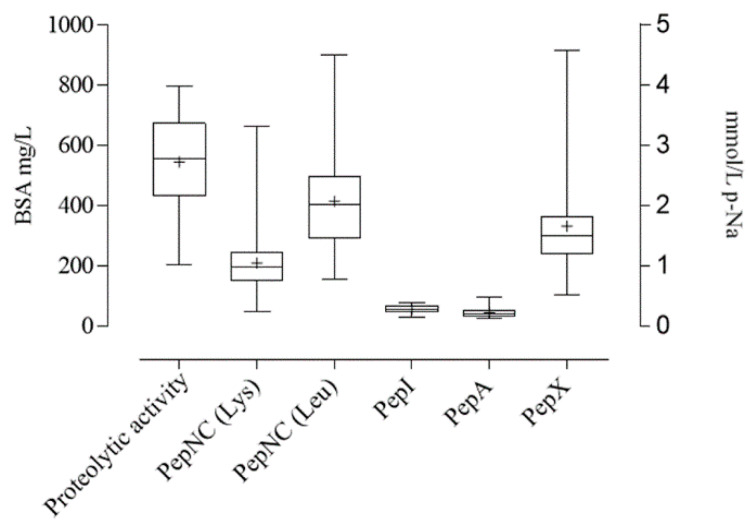
Figure 1.
Box plot representing LAB proteolytic activity (expressed as bovine serum albumin (BSA) mg/L and plotted on the left y-axis) and peptidase activities (expressed as p-nitroanilide (p-Na) mmol/L and plotted on the right axis). General aminopeptidase (PepNC) on L-lysine-p-nitroanilide and L-leucine-p-nitroanilide, proline iminopeptidase (PepI) on L-proline-p-nitroanilide, glutamyl aminopeptidase (PepA) on L-glutamic acid-p-nitroanilide and X-prolyldipeptidyl aminopeptidase (Pep X) on Gly-Pro-p-nitroanilide. The center line of each box represents the median, the mean is indicated by “+”, the top and bottom of the box represent the 75th and 25th percentile, respectively.

