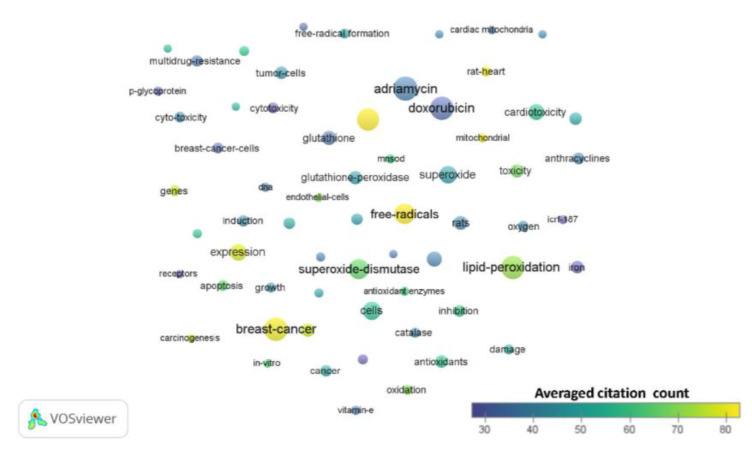
Figure 2.
Term map for years 1990–1999. Term map showing the visualization of 63 terms that occurred at least 10 times in documents between 1990 and 1999. Each circle represents a term. The size of the circle is proportional to the occurrences of the term (the bigger the circle, the higher the number of occurrences). Please refer to the color scale indicating averaged citation count. The proximity of circles indicates the frequency of co-occurrence between the two respective terms (the closer the proximity, the higher the frequency). Table S2 contains all the terms visualized with their respective occurrence frequencies and averaged citations.

