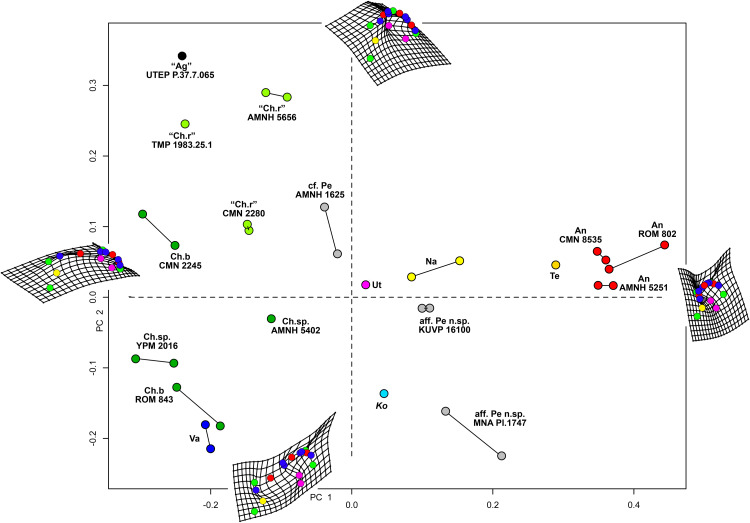
Figure 8. Morphometric analysis of chasmosaurine posterior parietals.
Deformation grids illustrate shape of left lateral ramus and median bar of each specimen at the end of each principal component axis (PC). Colored dots on deformation grids represent landmarks illustrated in Fig. 3. PC 1 (x axis) accounts for 50.5% of variation and assesses depth of the median embayment from shallow (negative) to deep (positive), and orientation of base of ep1 from mediolateral (negative) to anteroposterior (positive). PC 2 (y axis) accounts for 19.0% of variation. Points connected by a bar represent left and right sides of the same specimen (where adequately preserved). Pentaceratops through Anchiceratops plot along PC 1, demonstrating progressively deeper median embayment, and an increase in the angle of ep1. Chasmosaurus through to Vagaceratops are concentrated on the negative side of PC 1, following a trend from positive to negative along PC 2. Key: “Ag”, Agujaceratops; An, Anchiceratops; Ch.b, Chasmosaurus belli; cf. Ch.r, cf. "Chasmosaurus russelli"; Ko, Kosmoceratops; Na, Navajoceratops; aff. Pe n.sp., aff. Pentaceratops n. sp.; cf. Pe, cf. Pentaceratops sternbergii; Te, Terminocavus; Ut, Utahceratops; Va, Vagaceratops. Color to aid in distinction only.

